
History, 26.02.2021 08:40 iceecole6570
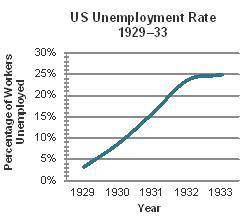
The graph shows the US unemployment rate from 1929 to 1933.
Based on the graph, which statement best describes the unemployment rate during the time period?
Government policies helped the unemployment rate drop to 5 percent.
The unemployment rate soared to 25 percent at its peak.
Government inaction led to a 50 percent unemployment rate.
The unemployment rate averaged about 15 percent each year.

Answers: 1


Another question on History
History, 22.06.2019 00:50
This paragraph has a sentence that does not belong. to find it, read the topic sentence again. which sentence is not about george washington? draw a line through that sentence.
Answers: 2
History, 22.06.2019 01:30
Describe the indian removal from north georgia. was the evacuation carried out according to plan? explain.
Answers: 1
History, 22.06.2019 01:30
Which best describes the impact of the crusades on european exploration?
Answers: 2
You know the right answer?
The graph shows the US unemployment rate from 1929 to 1933.
Based on the graph, which statement bes...
Questions
SAT, 11.04.2022 03:30


Mathematics, 11.04.2022 03:30

Physics, 11.04.2022 03:30
Mathematics, 11.04.2022 03:40
English, 11.04.2022 03:40


Social Studies, 11.04.2022 03:40


Social Studies, 11.04.2022 03:40
Mathematics, 11.04.2022 03:40

Health, 11.04.2022 03:50
Mathematics, 11.04.2022 03:50
Mathematics, 11.04.2022 03:50
Mathematics, 11.04.2022 04:00


