
History, 12.03.2021 09:50 gottapass62
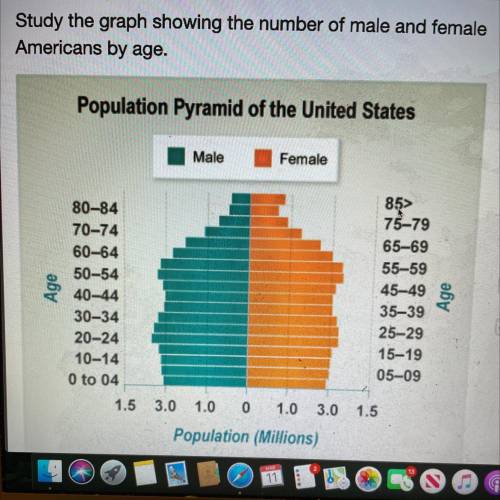
Based on the data in the graph, which statements are
correct interpretations about the US population? Select
three options.
Males outnumber females in several age ranges.
People in the 55-59 range have the greatest wealth.
People who are 20-24 outnumber those who are 40-
44.
The majority of people older than 70 are female.
In all ranges, there are about three males to every two
females.

Answers: 2


Another question on History
History, 22.06.2019 00:30
The map shows information about river valley civilizations. which feature of this map best the reader determine the distance between two places?
Answers: 1
History, 22.06.2019 00:30
Two types of resources are natural and human. true or false
Answers: 1
History, 22.06.2019 05:30
The political cartoon below was drawn by thomas nast in 1871: a political cartoon shows a heavy set man with a long nose and a beard in a suit and vest. he is smoking a cigar and has a menacing expression. he leans against a large box that says, in counting there is strength. on top of that box is a smaller container labeled, the ballot. dialogue under the cartoon reads, thats whats the matter. boss tweed, as long as i count the votes, what are you going to do about it? say? public domain what issue does this cartoon address?
Answers: 3
History, 22.06.2019 06:00
Which piece of information would most a historian create an interpretation of this photograph of works in a factory?
Answers: 2
You know the right answer?
Based on the data in the graph, which statements are
correct interpretations about the US populatio...
Questions


Mathematics, 16.10.2019 21:30


Mathematics, 16.10.2019 21:30
Mathematics, 16.10.2019 21:30
Health, 16.10.2019 21:30
Mathematics, 16.10.2019 21:30
History, 16.10.2019 21:30
Mathematics, 16.10.2019 21:30
Mathematics, 16.10.2019 21:30


