
History, 14.04.2021 16:20 polloAngelo7671
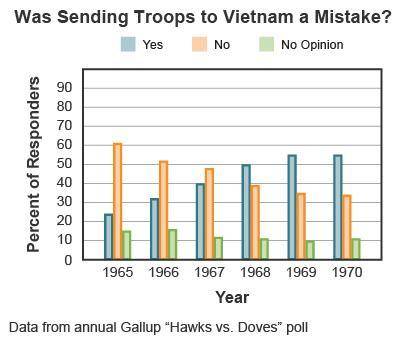
Study the graph showing US public opinion from 1965 to 1970.
A triple bar graph titled Was Sending Troops to Vietnam a Mistake? The x-axis is labeled Year from 1965 to 1970. The y-axis is labeled Percent of Responders from 0 to 90. The left bar is labeled yes. The middle bar is labeled no. The right bar is labeled no opinion. In 1965, over 20 percent say yes, 60 percent say no, and 15 percent have no opinion. In 1967, 40 percent say yes almost 50 percent say no, and 10 percent have no opinion. In 1970, over 50 percent say yes, over 30 percent say no, and 10 percent have no opinion.
Which statement about the Vietnam War is supported by the data in the graph?
The war was increasingly unpopular.
The war’s success led to greater support.
The war was of little importance to most Americans.
The war’s support did not change drastically over time.

Answers: 3


Another question on History
History, 21.06.2019 21:00
In western europe, under the , jews enjoyed some autonomy. then, during the post–french revolution period, was also tolerant toward the jews.
Answers: 2
History, 22.06.2019 04:30
4. argument take the perspective of a foreign soldier volunteering to serve in the united states in the fight against the british. write a letter to family back home explaining why you have decided to risk your life in this cause. me
Answers: 2
History, 22.06.2019 07:00
Which of the following statements about the economic consequences of the civil war is not accurate. a. inflation caused prices to rise by 80% in the north. b. because southern farms cannot process enough food for everyone in the south the union navy allowed food shipments from britain. c. to pay for all of the food supplies and arrangements that were necessary for the union army congress instituted an income tax. d. business boomed in the north as factories and farms always had a market for their products.
Answers: 3
You know the right answer?
Study the graph showing US public opinion from 1965 to 1970.
A triple bar graph titled Was Sending...
Questions

Biology, 16.07.2019 14:00

Chemistry, 16.07.2019 14:00

Biology, 16.07.2019 14:00

English, 16.07.2019 14:00
Mathematics, 16.07.2019 14:00
History, 16.07.2019 14:00

World Languages, 16.07.2019 14:00
Mathematics, 16.07.2019 14:00

Arts, 16.07.2019 14:00


