
History, 12.10.2019 15:00 leothedrifter
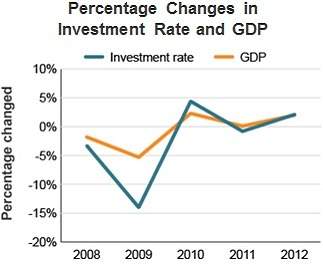
The graph shows the percentage changes in the investment rate and the gross domestic product (gdp) between 2008 and 2012.
the graph demonstrates that changes in investment
a) can show if the economy is growing or shrinking.
b) occur only when the economy is shrinking.
c) occur only when the economy is growing.
d) have no relation to changes to the gdp.

Answers: 2


Another question on History
History, 21.06.2019 23:00
In 150-200 words, name three advancements made by the egyptians and tell how they impacted the culture.
Answers: 1
History, 22.06.2019 00:00
What ways did native americans influence the lives of european settlers in early america ?
Answers: 1
History, 22.06.2019 00:00
What office did janet reno hold in the state of florida before becoming the first female united states attorney general
Answers: 1
You know the right answer?
The graph shows the percentage changes in the investment rate and the gross domestic product (gdp) b...
Questions

Geography, 25.11.2021 06:40


Mathematics, 25.11.2021 06:40


Computers and Technology, 25.11.2021 06:40
Chemistry, 25.11.2021 06:40
Biology, 25.11.2021 06:40

Spanish, 25.11.2021 06:40


