
Study the graph of the economic growth per person of North Korea and South Korea.
A line graph titled Economic Growth of North and South Korea (per person) from 1950 to 2010. The x-axis is labeled Year from 1950 to 2010. The y-axis is labeled Value of Economy (per person) from 0 to 25,000 dollars. South Korea and North Korea are at almost 0 in 1950. In 1970, North and South Korea are around 3,000 dollars. In 2000, South Korea is at 15,000 dollars and North Korea is near 1,000 dollars. In 2010, South Korea is over 20,000 dollars and North Korea is near 1,000 dollars.
Which postwar development is evident from the data in the graph?
The economy of North Korea did not improve following the end of the war.
Both countries experienced economic improvement in the half century following the war.
Improvement of the South Korean economy can be directly related to the end of the war.
The end of the war resulted in immediate improvement of the economy in both countries.
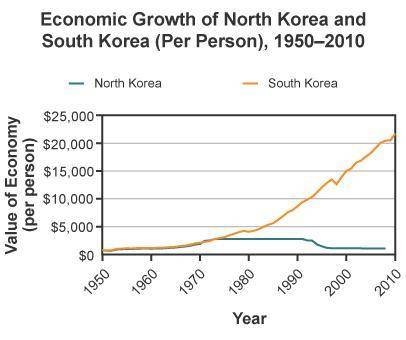

Answers: 3


Another question on History
History, 21.06.2019 23:30
How did the invention of the cotton gin affect slave labor in the united states? a. there was a forced migration of slaves from the south to the north. b. slave-owning cotton planters were gradually forced to sell their plantations. c. more slaves were purchased to work on cotton plantations in the south. d. the reduced need for labor on cotton plantations led to a decline in slavery. e. slaves were moved from cotton plantations to sugar plantations.
Answers: 2
History, 22.06.2019 08:00
And the spark struck out by that steed, in his flight, kindled the land into flame with its heat.what do you think he meant
Answers: 1
History, 22.06.2019 09:30
Final exam: us history playlist project instructions: in lieu of a final exam you will have a project that is due thursday june 20 @ 11.59pm this exam is worth 60 points. you may choose to complete the traditional exam or this exam. they are worth the exact same score i will simply exempt one, and give you credit for the other you are to create playlist of songs from each era we studied this year you will have anywhere from 10.12 songs depending on how you view the year you may do it on powerpoint word prezi spotify, itunes or anything else you can think of assignment find a song that you can relate to a histoncal era we discussed in order to earn full credit you must submit the name of the song and artist 2 the lyrics to that song either a portion or all with the lyrics highlighted that you feel remind you of something we studied i will not go searching for these make sure you include them 3 a 3-5 sentence paragraph that explains why these lyrics remind you of the era we studied. this is your chance to make connections to what you have learned prove me to me you understand what was going on in the world during this time period see rubric for grading specifics these same songs mo mendy's example: see next page (note: the example is for a us history course you may not i would do an image like this yours would have more songo)
Answers: 2
You know the right answer?
Study the graph of the economic growth per person of North Korea and South Korea.
A line graph titl...
Questions

English, 06.12.2019 22:31


Mathematics, 06.12.2019 22:31
Mathematics, 06.12.2019 22:31

Health, 06.12.2019 22:31
Mathematics, 06.12.2019 22:31

History, 06.12.2019 22:31
Mathematics, 06.12.2019 22:31

Geography, 06.12.2019 22:31


