
History, 24.10.2021 19:50 broyochey1
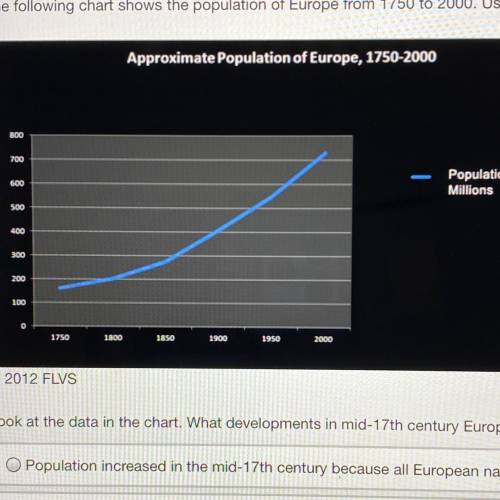
Look at the data in the chart. What developments in mid-17th century Europe help explain this
O Population increased in the mid-17th century because all European nations united under a
O Population decreased in the mid-17th century because most political systems were unsta
Population increased in the mid-17th century because there was more religious tolerance a
O Population stayed the same in the mid-17th century because immigration and emigration ra
Question 25(Multiple Choice Worth 5 points)
(05.05 LC)

Answers: 2


Another question on History
History, 22.06.2019 10:00
The senate differs from the house of representatives in that representatives serve for terms, while senators serve terms. question 18 options: six year, four year four year, six year two year, six year six year, two year
Answers: 1
History, 22.06.2019 14:30
In november 1947, how did the united states try and resolve the issue of palestine?
Answers: 1
You know the right answer?
Look at the data in the chart. What developments in mid-17th century Europe help explain this
O Po...
Questions
History, 08.03.2021 18:00


Mathematics, 08.03.2021 18:00


Arts, 08.03.2021 18:00

Health, 08.03.2021 18:00
Mathematics, 08.03.2021 18:00

Physics, 08.03.2021 18:00

Biology, 08.03.2021 18:00
Biology, 08.03.2021 18:00


