
History, 14.12.2021 20:40 leilei2003
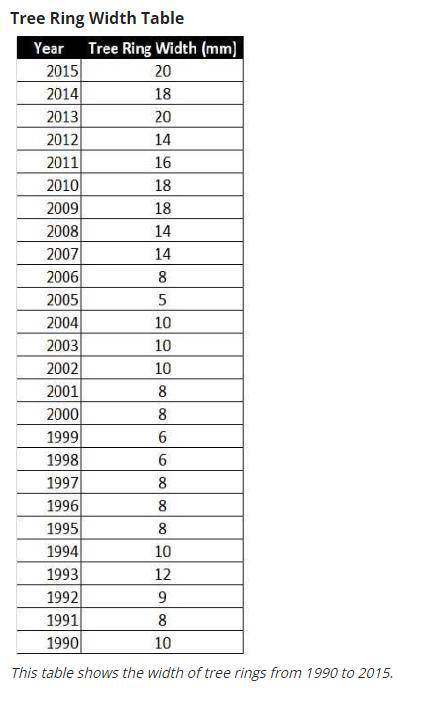
Use the data to create a line graph with “Year” along the x-axis and “Tree Ring Width (mm)” along the y-axis.
Using your graph, which year or years can you infer had the least amount of precipitation (rain)? Which year or years had the most amount of precipitation (rain)? Use evidence from your Tree Ring Width graph to explain your reasoning.
I think that _ had the least amount of precipitation because...
I that that _ had the most amount of precipitation because...

Answers: 2


Another question on History
History, 21.06.2019 17:10
Why would the isolation of buddhist monks contribute to the religion’s decline?
Answers: 1
History, 21.06.2019 22:00
What are two effects of the lack of representation of the third estate in the estates-general? two answers
Answers: 1
History, 22.06.2019 00:00
In the 1980s, more russians worked to encourage change in the government by a) establishing a new political system. b) rallying for democratic reforms. c) supporting the democratic system. d) resisting gorbachev’s reforms.
Answers: 1
History, 22.06.2019 05:00
Knights are to chivalry what samurai are to a. bushido c. buddhism b. shinto d. none of these select the best answer from the choices provided a b c d
Answers: 1
You know the right answer?
Use the data to create a line graph with “Year” along the x-axis and “Tree Ring Width (mm)” along th...
Questions


Geography, 27.08.2020 06:01

Social Studies, 27.08.2020 06:01
Mathematics, 27.08.2020 06:01

Health, 27.08.2020 06:01
Mathematics, 27.08.2020 06:01
Mathematics, 27.08.2020 06:01


