
Mathematics, 20.07.2019 08:00 Gbecky122
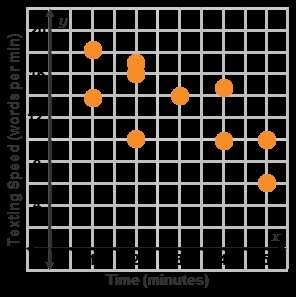
The graph shows the data of texting speed according to time. use the scatterplot to determine if there is a relationship. if there is a relationship, explain it. yes, there is a relationship. as time increases, texting speed increases. yes, there is a relationship. as time increases, texting speed decreases. yes, there is a relationship. as texting speed increases, time increases. no, there is no relationship displayed.

Answers: 1


Another question on Mathematics
Mathematics, 21.06.2019 14:30
Aswimming pool has an input pump for filling the pool and an output pump for emptying the pool. the input pump can fill the pool in 3 hours, and the output pump can drain the pool in 5 hours. as you go to bed, the pool is full, but a neighbor’s kid turns on the output pump. at midnight, you awake to find the pool half empty. immediately, you turn on the input pump, but you are sleepy and forget to turn off the output pump. at what time will the pool become full?
Answers: 1
Mathematics, 21.06.2019 15:00
Which is equivalent to 10/12? options: 10/18 5/6 3/12 9/11
Answers: 2
Mathematics, 21.06.2019 15:10
Aboat's value over time is given as the function f(x) and graphed below. use a(x) = 400(b)x + 0 as the parent function. which graph shows the boat's value increasing at a rate of 25% per year?
Answers: 3
Mathematics, 21.06.2019 18:30
F(x)=x^3+4 question 6 options: the parent function is shifted up 4 units the parent function is shifted down 4 units the parent function is shifted left 4 units the parent function is shifted right 4 units
Answers: 1
You know the right answer?
The graph shows the data of texting speed according to time. use the scatterplot to determine if the...
Questions
Mathematics, 04.02.2020 22:46


Social Studies, 04.02.2020 22:46

Mathematics, 04.02.2020 22:46


World Languages, 04.02.2020 22:46
English, 04.02.2020 22:46
Mathematics, 04.02.2020 22:46


