Mathematics, 20.07.2019 07:00 statonglenda
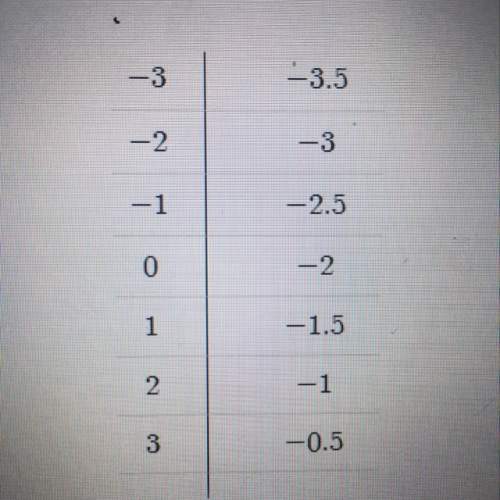
The graph below shows a company's profit f(x), in dollars, depending on the price of pens x, in dollars, being sold by the company: part a: what do the x-intercepts and maximum value of the graph represent? what are the intervals where the function is increasing and decreasing, and what do they represent about the sale and profit? part b: what is an approximate average rate of change of the graph from x = 3 to x = 5, and what does this rate represent?

Answers: 1


Another question on Mathematics

Mathematics, 21.06.2019 16:10
In a sample of 200 residents of georgetown county, 120 reported they believed the county real estate taxes were too high. develop a 95 percent confidence interval for the proportion of residents who believe the tax rate is too high. (round your answers to 3 decimal places.) confidence interval for the proportion of residents is up to . would it be reasonable to conclude that the majority of the taxpayers feel that the taxes are too high?
Answers: 3

Mathematics, 21.06.2019 20:00
Mario has $14.35 left in his wallet. he spent $148.43 for tablecloths. then, he spent $92.05 for napkins. how much money did mario have in his wallet to start with?
Answers: 2


Mathematics, 21.06.2019 23:00
Jane’s favorite fruit punch consists of pear, pineapple, and plum juices in the ratio 5: 2: 3. chapter reference how much punch can she make if she has only 6 cups of plum juice?
Answers: 1
You know the right answer?
The graph below shows a company's profit f(x), in dollars, depending on the price of pens x, in doll...
Questions


Social Studies, 24.05.2021 14:00


English, 24.05.2021 14:00


Geography, 24.05.2021 14:00

Mathematics, 24.05.2021 14:00


Computers and Technology, 24.05.2021 14:00


Mathematics, 24.05.2021 14:00


Mathematics, 24.05.2021 14:00


English, 24.05.2021 14:00

Biology, 24.05.2021 14:00


