
Mathematics, 20.07.2019 02:30 20eppsj
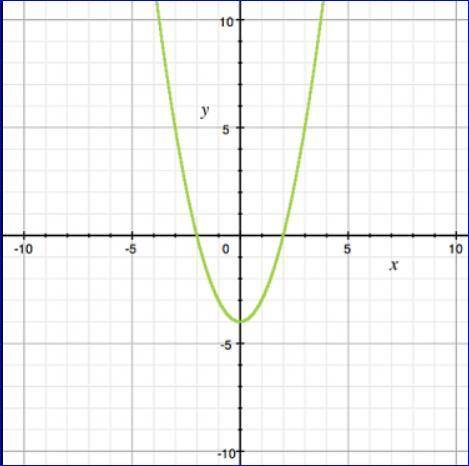
Which graph represents the parent function of y=x^2 −5? i believe it'd be the second one but how do you figure this out?

Answers: 1


Another question on Mathematics
Mathematics, 21.06.2019 14:30
Describe in detail how you would construct a 95% confidence interval for a set of 30 data points whose mean is 20 and population standard deviation is 3. be sure to show that you know the formula and how to plug into it. also, clearly state the margin of error.
Answers: 3
Mathematics, 21.06.2019 14:30
Acommunity group sells 2,000 tickets for its raffle. the grand prize is a car. neil and 9 of his friends buy 10 tickets each. when the winning ticket number is announced, it is found to belong to neil's group. given this information, what is the probability that the ticket belongs to neil? a.1/5 b.1/10 c.1/200 d.1/4
Answers: 2
Mathematics, 21.06.2019 15:40
What is the first quartile of this data set? 10, 11, 12, 15, 17, 19, 22, 24, 29, 33, 38 a. 12 b. 19 c. 29 d. 10
Answers: 1
Mathematics, 21.06.2019 15:40
The standard distance between studs in a house is 1.5 feet. if you have a set of blueprints for a house that mark every 1.5 feet with 2 in., by how many inches will a 13-foot wall be represented?
Answers: 3
You know the right answer?
Which graph represents the parent function of y=x^2 −5? i believe it'd be the second one but how do...
Questions
Mathematics, 24.05.2021 20:40


Geography, 24.05.2021 20:50
Mathematics, 24.05.2021 20:50
English, 24.05.2021 20:50
Mathematics, 24.05.2021 20:50
Mathematics, 24.05.2021 20:50


Biology, 24.05.2021 20:50
Chemistry, 24.05.2021 20:50

Mathematics, 24.05.2021 20:50
Mathematics, 24.05.2021 20:50
Physics, 24.05.2021 20:50
Biology, 24.05.2021 20:50


