
Mathematics, 18.07.2019 20:00 Adot23x
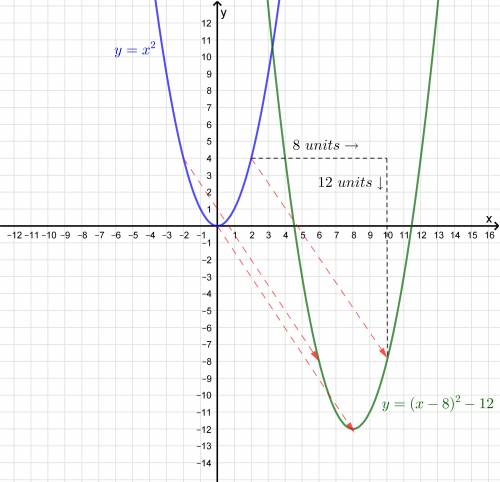
15 points! describe how the graph of y= x2 can be transformed to the graph of the given equation. y = (x - 8)^2 - 12 a) shift the graph of y = x2 left 8 units and then down 12 units. b) shift the graph of y = x2 right 8 units and then up 12 units. c) shift the graph of y = x2 down 8 units and then left 12 units. d) shift the graph of y = x2 right 8 units and then down 12 units.

Answers: 1


Another question on Mathematics
Mathematics, 21.06.2019 21:30
Ijust need these 2 questions answered (the second pic is just confirmation i'm not confident in that answer)
Answers: 1
Mathematics, 22.06.2019 00:50
Identify the statement below as either descriptive or inferential statistics. upper a certain website sold an average of 117 books per day last week. is the statement an example of descriptive or inferential statistics? a. it is an example of descriptive statistics because it uses a sample to make a claim about a population. b. it is an example of inferential statistics because it uses a sample to make a claim about a population. c. it is an example of inferential statistics because it summarizes the information in a sample. d. it is an example of descriptive statistics because it summarizes the information in a sample.
Answers: 1
Mathematics, 22.06.2019 02:30
Graph the function =gx+2x3 and give its domain and range using interval notation.
Answers: 3
You know the right answer?
15 points! describe how the graph of y= x2 can be transformed to the graph of the given equation....
Questions

English, 02.04.2020 15:34


Geography, 02.04.2020 15:36


Chemistry, 02.04.2020 15:37


