
Mathematics, 16.07.2019 16:30 Savageboyn
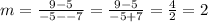
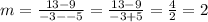
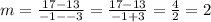
Is the relationship shown by the data linear? if so, model the data with an equation. x y –7 5 –5 9 –3 13 –1 17 the relationship is linear; y – 5 = mc019-3.jpg(x + 7). the relationship is linear; y + 7 = mc019-1.jpg(x – 5). the relationship is not linear. the relationship is linear; y – 5 = mc019-2.jpg(x + 7).

Answers: 1


Another question on Mathematics
Mathematics, 21.06.2019 19:00
Ab based on the given diagram, if m_1 = 60° then m 2 = 30 60 90 180
Answers: 1
Mathematics, 21.06.2019 19:30
Plz.yesterday, the snow was 2 feet deep in front of archie’s house. today, the snow depth dropped to 1.6 feet because the day is so warm. what is the percent change in the depth of the snow?
Answers: 1
Mathematics, 21.06.2019 19:30
00 points ! missy’s rotation maps point k(17, –12) to k’(12, 17). which describes the rotation? 270° counterclockwise rotation 90° counterclockwise rotation 90° clockwise rotation 180° rotation
Answers: 1
Mathematics, 21.06.2019 21:30
Amachine part consists of a half sphere and a cylinder, as shown in the figure. the total volume of the part is π cubic inches.
Answers: 1
You know the right answer?
Is the relationship shown by the data linear? if so, model the data with an equation. x y –7 5 –5...
Questions
Mathematics, 05.05.2020 06:11

Social Studies, 05.05.2020 06:11

History, 05.05.2020 06:11

Mathematics, 05.05.2020 06:11
Mathematics, 05.05.2020 06:11
Mathematics, 05.05.2020 06:11

Mathematics, 05.05.2020 06:11
History, 05.05.2020 06:11
Mathematics, 05.05.2020 06:11
History, 05.05.2020 06:11

English, 05.05.2020 06:11


