Mathematics, 16.07.2019 03:00 serenitynycole
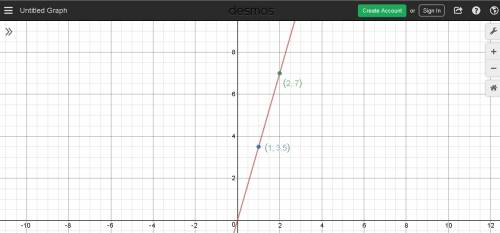
Which statement best explains if the graph correctly represents the proportional relationship y = 3.5x? a graph of a coordinate plane is shown. points are graphed at 1 comma 3.5 and 2 comma 7. the points are joined by a line. no, the points shown on the line would not be part of y = 3.5x no, proportions cannot be represented on a graph yes, the points shown on the line would be part of y = 3.5x yes, all proportions can be shown on the graph of this line

Answers: 2


Another question on Mathematics

Mathematics, 21.06.2019 23:00
The table below shows the function f. determine the value of f(3) that will lead to an average rate of change of 19 over the interval [3, 5]. a. 32 b. -32 c. 25 d. -25
Answers: 2

Mathematics, 22.06.2019 00:40
Which linear function represents the line given by the point-slope equation y + 1 = –3(x – 5)?
Answers: 1

Mathematics, 22.06.2019 11:30
1cubic metre of concrete has a weight of 2400 kg 15 of the concrete is water the rest of the concrete are cement, sandand stone the weight of these ingredients are in the ratio 1: 2: 5 work ouyt the weight of cement, sand and stone in 1 cubic metre of cement
Answers: 2

Mathematics, 22.06.2019 12:00
Acircular swimming pool is 21 feet in diameter.what is the circumference of the swimming pool
Answers: 1
You know the right answer?
Which statement best explains if the graph correctly represents the proportional relationship y = 3....
Questions


Social Studies, 19.05.2020 19:57


Mathematics, 19.05.2020 19:57


History, 19.05.2020 19:57

Mathematics, 19.05.2020 19:58


Mathematics, 19.05.2020 19:58


Social Studies, 19.05.2020 19:58


Mathematics, 19.05.2020 19:58

Biology, 19.05.2020 19:58


 or
or 
 ------> is a positive slope
 -----> is correct
 -----> is correct


