
Mathematics, 22.09.2019 05:00 michaellevingston46
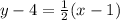
Is the relationship shown by the data linear? if so, model the data with an equation. x y 1 –4 7 –7 13 –10 19 –13 the relationship is linear; y + 4 = (x – 1). the relationship is linear; y + 4 = (x – 1). the relationship is not linear. the relationship is linear; y – 1 = (x + 4)?

Answers: 1


 .
.

Another question on Mathematics
Mathematics, 21.06.2019 15:40
The number of lattes sold daily for two coffee shops is shown in the table: lattes 12 52 57 33 51 15 46 45 based on the data, what is the difference between the median of the data, including the possible outlier(s) and excluding the possible outlier(s)? 48.5 23 8.4 3
Answers: 3
Mathematics, 21.06.2019 19:30
Sundar used linear combination to solve the system of equations shown. he did so by multiplying the first equation by 5 and the second equation by another number to eliminate the y-terms. what number did sundar multiply the second equation by? 2x+9y=41 3x+5y=36
Answers: 1
Mathematics, 21.06.2019 20:30
8. kelly wants to buy a magazine that is $25. later the magazine was marked up an additional 20%. what is the new price?
Answers: 1
Mathematics, 21.06.2019 23:30
Abaseball team drinks 10/4 gallons of water during a game. which mixed number represents the gallons of water consumed? a) 1 1/2 gallons b) 2 1/2 gallons c) 2 3/4 gallons d) 3 1/2 gallons
Answers: 2
You know the right answer?
Is the relationship shown by the data linear? if so, model the data with an equation. x y 1 –4 7 –7...
Questions


Arts, 12.02.2021 22:40
Chemistry, 12.02.2021 22:40

English, 12.02.2021 22:40

Mathematics, 12.02.2021 22:40

Mathematics, 12.02.2021 22:40
Mathematics, 12.02.2021 22:40
Social Studies, 12.02.2021 22:40


