
Mathematics, 12.07.2019 10:30 AgentPangolin
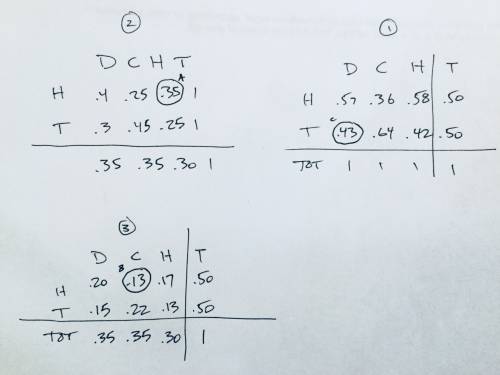
Each table represents the results of a survey taken by a pop culture magazine regarding where movie viewers prefer to watch different genres of movies. determine which relative frequency table would be the best choice to find each piece of information. the percentage of home viewers who prefer to watch horror movies the percentage of people surveyed who prefer to watch comedy movies at home the percentage of viewers with a preference for drama who watch at the theater drama comedy horror total home 0.57 0.36 0.58 0.50 theater 0.43 0.64 0.42 0.50 total 1 1 1 1 drama comedy horror total home 0.40 0.25 0.35 1 theater 0.30 0.45 0.25 1 total 0.35 0.35 0.30 1 drama comedy horror total home 0.20 0.13 0.17 0.50 theater 0.15 0.22 0.13 0.50 total 0.35 0.35 0.30 1

Answers: 1


Another question on Mathematics
Mathematics, 21.06.2019 12:30
Started: jun 20 at 10: 35pm quiz instructions question 3 y 2x+4 graph the system of linear inequalities 1 by < 2x-2 ty
Answers: 3
Mathematics, 21.06.2019 14:00
Find the volume of the solid generated when the region bounded by y= x and y= 4√x is revolved about the x-axis the volume of the solid is: (type an exact answer cubic units)
Answers: 1
Mathematics, 21.06.2019 17:00
Somone me i want to know what 18 hours out of 24 hours in a fraction
Answers: 1
You know the right answer?
Each table represents the results of a survey taken by a pop culture magazine regarding where movie...
Questions
Mathematics, 25.06.2019 06:30


Biology, 25.06.2019 06:30


Physics, 25.06.2019 06:30

History, 25.06.2019 06:30

Mathematics, 25.06.2019 06:30

Social Studies, 25.06.2019 06:30
Mathematics, 25.06.2019 06:30
Mathematics, 25.06.2019 06:30


