
Mathematics, 10.07.2019 20:30 ceve18
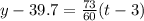
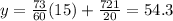
For 1983 through 1989, the per capita consumption of chicken in the u. s. increased at a rate that was approximately linear. in 1983, the per capita consumption was 39.7 pounds, and in 1989 it was 47 pounds. write a linear model for per capita consumption of chicken in the u. s. let t represent time in years, where t = 3 represents 1983. let y represent chicken consumption in pounds. what would you expect the per capita consumption of chicken to be in 1995? what would you expect the per capita consumption of chicken to be in 1995?

Answers: 1


Another question on Mathematics
Mathematics, 21.06.2019 19:40
What is the slope of the line that contains the points (-2,1) and (0,-3)
Answers: 2
Mathematics, 21.06.2019 20:30
The frequency table shows the results of a survey comparing the number of beach towels sold for full price and at a discount during each of the three summer months. the store owner converts the frequency table to a conditional relative frequency table by row. which value should he use for x? round to the nearest hundredth. 0.89 0.90 0.92 0.96
Answers: 2
Mathematics, 22.06.2019 02:30
Carlos by 24 mi and ran 6 miles what is the ratio of the distance carlos ran to the distance he biked
Answers: 1
You know the right answer?
For 1983 through 1989, the per capita consumption of chicken in the u. s. increased at a rate that w...
Questions
Mathematics, 07.06.2021 06:50
Mathematics, 07.06.2021 06:50

Spanish, 07.06.2021 06:50
Mathematics, 07.06.2021 06:50

English, 07.06.2021 06:50
English, 07.06.2021 06:50


Mathematics, 07.06.2021 06:50

History, 07.06.2021 06:50

Chemistry, 07.06.2021 06:50
Mathematics, 07.06.2021 06:50
History, 07.06.2021 06:50
Mathematics, 07.06.2021 06:50

Social Studies, 07.06.2021 06:50


