
Mathematics, 10.07.2019 10:30 firenation18
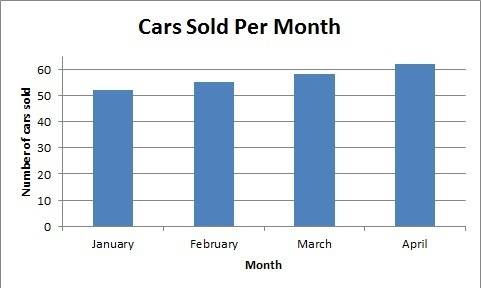
Math (use first pic for first two questions.) 1. what might the creator of this graph want the reader to conclude? ·the car dealer sold twice as many cars in april as in january. ·the car dealer sold the most cars in january. ·the car dealer's business is expanding very rapidly. ·the car dealer sold three times as many cars in march as in february. 2. what is one way to make this graph less misleading? · use wider bars for each month. · start the y-axis at 50 and use an interval of 1. ·use different colors for each month. ·start the y-axis at zero and use an interval of 5 or 10. (use second pic for this question.) 3. the camera shop wants to use the measure of central tendency that expresses how successful they are in selling cameras. which measure of central tendency should they choose? ·mean ·interquartile range ·mode ·median

Answers: 1


Another question on Mathematics
Mathematics, 21.06.2019 16:20
Under normal conditions, 1.5 feet of snow will melt into 2 inches of water. during a winter season high in the mountains, 301 feet of snow fell. how many inches of water will there be when the snow melts?
Answers: 1
Mathematics, 21.06.2019 22:00
You buy 4 items that cost 2.69 14.45 8.05 13.95 what is the estimated total round to the nearest dollar
Answers: 1
Mathematics, 21.06.2019 23:30
Find measure angle 1 and measure angle 3 in the kite the diagram is not drawn on the scale
Answers: 1
Mathematics, 22.06.2019 00:40
What is the interquartile range (iqr) of the data set represented by this box plot?
Answers: 3
You know the right answer?
Math (use first pic for first two questions.) 1. what might the creator of this graph want the read...
Questions

Mathematics, 05.05.2020 03:38

Health, 05.05.2020 03:38

History, 05.05.2020 03:38
Mathematics, 05.05.2020 03:38
Mathematics, 05.05.2020 03:38

Law, 05.05.2020 03:38
English, 05.05.2020 03:38

Spanish, 05.05.2020 03:38

Biology, 05.05.2020 03:38
Mathematics, 05.05.2020 03:38


