
Mathematics, 09.07.2019 10:30 andybiersack154
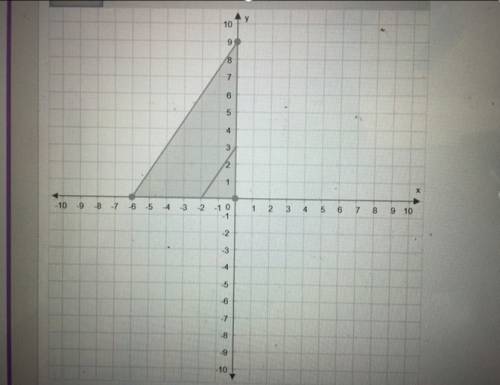
Graph the image of the given triangle under a dilation with a scale factor of 1/3 and center of dilation (0, 0) .

Answers: 2
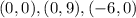
 about the origin , the image triangle will have vertices
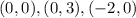


Another question on Mathematics
Mathematics, 21.06.2019 18:30
Haruka hiked several kilometers in the morning. she hiked only 66 kilometers in the afternoon, which was 25% less than she had hiked in the morning. how many kilometers did haruka hike in all?
Answers: 3
Mathematics, 21.06.2019 22:00
Match the scale and the actual area to the area of the corresponding scale drawing. scale: 1 inch to 4 feet actual area: 128 square feet scale: 1 inch to 7 feet actual area: 147 square feet scale: 1 inch to 8 feet actual area: 256 square feet scale: 1 inch to 5 feet actual area: 225 square feet area of scale drawing scale and actual area scale drawing area: 3 square inches arrowright scale drawing area: 8 square inches arrowright scale drawing area: 4 square inches arrowright scale drawing area: 9 square inches arrowright
Answers: 2
Mathematics, 21.06.2019 22:30
Which of the functions below could have created this graph?
Answers: 1
Mathematics, 22.06.2019 00:00
(20 points) a bank has been receiving complaints from real estate agents that their customers have been waiting too long for mortgage confirmations. the bank prides itself on its mortgage application process and decides to investigate the claims. the bank manager takes a random sample of 20 customers whose mortgage applications have been processed in the last 6 months and finds the following wait times (in days): 5, 7, 22, 4, 12, 9, 9, 14, 3, 6, 5, 15, 10, 17, 12, 10, 9, 4, 10, 13 assume that the random variable x measures the number of days a customer waits for mortgage processing at this bank, and assume that x is normally distributed. 2a. find the sample mean of this data (x ě…). 2b. find the sample variance of x. find the variance of x ě…. for (c), (d), and (e), use the appropriate t-distribution 2c. find the 90% confidence interval for the population mean (îľ). 2d. test the hypothesis that îľ is equal to 7 at the 95% confidence level. (should you do a one-tailed or two-tailed test here? ) 2e. what is the approximate p-value of this hypothesis?
Answers: 2
You know the right answer?
Graph the image of the given triangle under a dilation with a scale factor of 1/3 and center of dila...
Questions


Health, 06.10.2019 21:00
Mathematics, 06.10.2019 21:00

Biology, 06.10.2019 21:00
Mathematics, 06.10.2019 21:00


History, 06.10.2019 21:00
History, 06.10.2019 21:00
Chemistry, 06.10.2019 21:00


