
Mathematics, 01.12.2019 17:31 simrankaurdhatt
In this investigation, you will be solving and interpreting several rate problems. be sure to show your calculations.
problem #1:
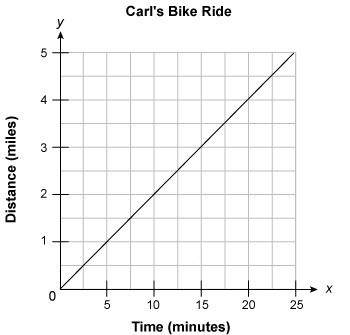
look at the following graph of carl’s travel time and distance:
what is carl’s constant rate of speed (in miles per hour)?
how many miles will carl have traveled after 2 hours?
problem #2:
look at the following equation:
–4x + y = 10
what is the slope of this line?
what is the value of y when x = 3?
problem #3:
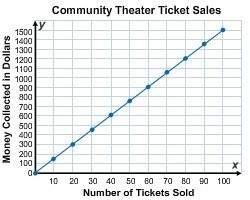
what is the rate (in dollars per ticket)?
how much money will the theater earn if it sells 150 tickets?
problem #4:
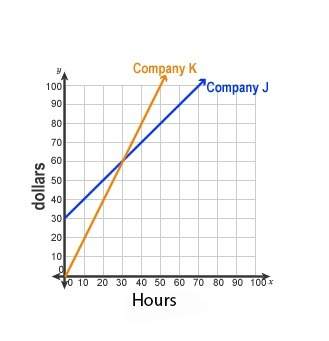
karen is trying to choose a cell phone plan. company j charges a subscription fee of $30 per month plus $1 per hour of use. company k charges no monthly fee, but charges $2 for every hour of use.
karen made the following graph to compare the prices of the two plans:
the lines for company j and company k cross at a point. the coordinate (30, 60) is the point at which company j and company k cost the same.
what does the point (30, 60) mean? (hint: what is being graphed on the x-axis? what is being graphed on the y-axis? )
if karen uses her cell phone for less than 30 hours a month, which company should karen choose? why?
if karen uses her cell phone for more than 30 hours a month, which company should karen choose? why?

Answers: 2


Another question on Mathematics
Mathematics, 21.06.2019 14:50
Eight people were asked what the balance of their savings account at the beginning of the month was and how much it increased or decreased by the end of the month. create a scatter plot that represents the data that is shown in the table. the x-axis represents the beginning balance in thousands of dollars and the y-axis represents the change in the savings account in hundreds of dollars. name beginning balance (in thousands of dollars) change in savings account (in hundreds of dollars) jimmy 5 3 kendra 4 7 carlos 5 4 yolanda 3 1 shawn 2 5 laura 3 2 andy 5 6 georgia 4 3
Answers: 1
Mathematics, 21.06.2019 16:30
In two or more complete sentences, determine the appropriate model for the given data and explain how you made your decision. (1,-1), (2,0.5), (5,1.5), (8,2)
Answers: 2
Mathematics, 21.06.2019 18:00
The sat and act tests use very different grading scales. the sat math scores follow a normal distribution with mean 518 and standard deviation of 118. the act math scores follow a normal distribution with mean 20.7 and standard deviation of 5. suppose regan scores a 754 on the math portion of the sat. how much would her sister veronica need to score on the math portion of the act to meet or beat regan's score?
Answers: 1
Mathematics, 21.06.2019 19:00
Amodel rocket is launched from a roof into a large field. the path of the rocket can be modeled by the equation y = -0.04x^2 + 8.6x + 4.8, where x is the horizontal distance, in meters, from the starting point on the roof and y is the height, in meters, of the rocket above the ground. how far horizontally from its starting point will the rocket land? a. 0.56 m b. 215.56 m c. 431.11 m d. 215.74 m
Answers: 1
You know the right answer?
In this investigation, you will be solving and interpreting several rate problems. be sure to show y...
Questions

Biology, 30.06.2019 07:00

Computers and Technology, 30.06.2019 07:00
Mathematics, 30.06.2019 07:00


Mathematics, 30.06.2019 07:00
English, 30.06.2019 07:00

Computers and Technology, 30.06.2019 07:00


Advanced Placement (AP), 30.06.2019 07:00


Mathematics, 30.06.2019 07:00
Spanish, 30.06.2019 07:00


