
Mathematics, 28.08.2019 08:50 gigi1103
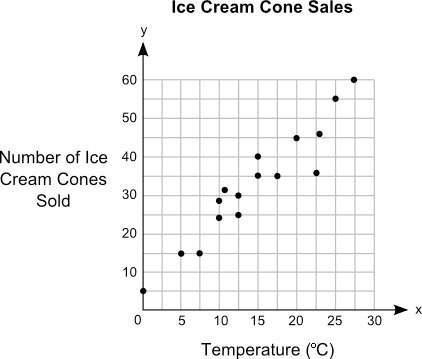
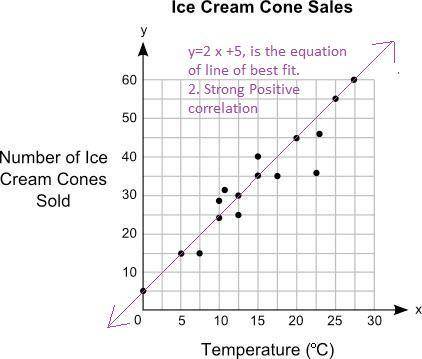
Jack plotted the graph below to show the relationship between the temperature of his city and the number of ice cream cones he sold daily: part a: in your own words, describe the relationship between the temperature of the city and the number of ice cream cones sold. (5 points)
part b: describe how you can make the line of best fit. write the approximate slope and y-intercept of the line of best fit. show your work, including the points that you use to calculate slope and y-intercept. (5 points)

Answers: 2


Another question on Mathematics
Mathematics, 21.06.2019 21:10
Aplane intersects a pris paralel to the base of the prism. the cross section is a polygon wth eight sides. how many sides does the base of the prism have? a. 10 b. 8 c. 7 d. 9
Answers: 1
Mathematics, 21.06.2019 22:00
You are standing next to a really big circular lake. you want to measure the diameter of the lake, but you don't want to have to swim across with a measuring tape! you decide to walk around the perimeter of the lake and measure its circumference, and find that it's 400\pi\text{ m}400? m. what is the diameter dd of the lake?
Answers: 3
Mathematics, 21.06.2019 23:00
Calculate the average rate of change over the interval [1, 3] for the following function. f(x)=4(5)^x a. -260 b. 260 c. 240 d. -240
Answers: 1
You know the right answer?
Jack plotted the graph below to show the relationship between the temperature of his city and the nu...
Questions


Health, 03.02.2020 18:53

Chemistry, 03.02.2020 18:53
Mathematics, 03.02.2020 18:53

English, 03.02.2020 18:53
Mathematics, 03.02.2020 18:53

Physics, 03.02.2020 18:53
Physics, 03.02.2020 18:53

Mathematics, 03.02.2020 18:53
Social Studies, 03.02.2020 18:53

Mathematics, 03.02.2020 18:53


