
Mathematics, 06.07.2019 00:30 conyabrew82
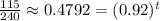
Jordan works in a science lab where he is studying the behavior of a certain unstable isotope. he has 240 milligrams of the sample, and the amount of the substance remaining in the sample decreases at a rate of 8% each day. after t days, there are less than 115 milligrams of the substance remaining. which inequality represents this situation, and after how many days will the amount of the sample be less than 115 milligrams? a. 115(0.92)t < 240; 10 days b. 240(1.08)t < 115; 9 days c. 240(0.92)t < 115; 9 days d. 115(1.08)t < 240; 8 days

Answers: 1
 . Therefore,
  .
. . Therefore,
  .
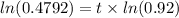
. . Let us represent this by
  .
. , where t is the time.
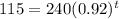

 days<9 days

Another question on Mathematics
Mathematics, 21.06.2019 19:00
Since opening night, attendance at play a has increased steadily, while attendance at play b first rose and then fell. equations modeling the daily attendance y at each play are shown below, where x is the number of days since opening night. on what day(s) was the attendance the same at both plays? what was the attendance? play a: y = 8x + 191 play b: y = -x^2 + 26x + 126 a. the attendance was never the same at both plays. b. the attendance was the same on day 5. the attendance was 231 at both plays on that day. c. the attendance was the same on day 13. the attendance was 295 at both plays on that day. d. the attendance was the same on days 5 and 13. the attendance at both plays on those days was 231 and 295 respectively.
Answers: 1
Mathematics, 21.06.2019 20:00
Solve for x and y a x= 13.3 y= 16.7 b x= 23.3 y= 12.5 c x= 7.5 y= 16.7 d x=7.5 y= 12.5
Answers: 1
Mathematics, 22.06.2019 01:00
The weight of 46 new patients of a clinic from the year 2018 are recorded and listed below. construct a frequency distribution, using 7 classes. then, draw a histogram, a frequency polygon, and an ogive for the data, using the relative information from the frequency table for each of the graphs. describe the shape of the histogram. data set: 130 192 145 97 100 122 210 132 107 95 210 128 193 208 118 196 130 178 187 240 90 126 98 194 115 212 110 225 187 133 220 218 110 104 201 120 183 124 261 270 108 160 203 210 191 180 1) complete the frequency distribution table below (add as many rows as needed): - class limits - class boundaries - midpoint - frequency - cumulative frequency 2) histogram 3) frequency polygon 4) ogive
Answers: 1
Mathematics, 22.06.2019 02:30
F(x) = x^2+x-2/x^2-3x-4 what is the domain and range, x-and y-intercepts, horizontal asymptotes, and vertical asymptotes?
Answers: 3
You know the right answer?
Jordan works in a science lab where he is studying the behavior of a certain unstable isotope. he ha...
Questions
Mathematics, 19.11.2019 18:31

Mathematics, 19.11.2019 18:31


Computers and Technology, 19.11.2019 18:31

Computers and Technology, 19.11.2019 18:31
Mathematics, 19.11.2019 18:31
Computers and Technology, 19.11.2019 18:31
Computers and Technology, 19.11.2019 18:31


