
Mathematics, 05.07.2019 01:00 janiya666
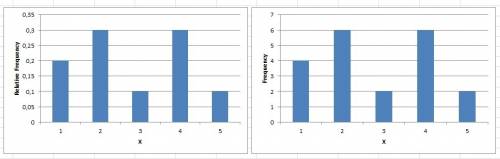
:( the frequency table was made using a spinner with sections numbered 1 through 5. x f 1 4 2 6 3 2 4 6 5 2 create a bar graph by dragging the sliders on the horizontal axis to represent the probability distribution.

Answers: 1


Another question on Mathematics
Mathematics, 21.06.2019 19:20
Which of the following is the result of expanding the series
Answers: 1
Mathematics, 21.06.2019 19:50
If your teacher tells you to do questions 6 through 19 in your math book for homework, how many questions is that
Answers: 1
Mathematics, 21.06.2019 21:00
Rewrite the following quadratic functions in intercept or factored form. show your work. y = 9 + 12x + 4x^2
Answers: 2
Mathematics, 21.06.2019 23:10
Which graph represents the linear function below? y-4= (4/3)(x-2)
Answers: 2
You know the right answer?
:( the frequency table was made using a spinner with sections numbered 1 through 5. x f 1 4 2 6 3 2...
Questions
Engineering, 11.05.2021 07:40
Mathematics, 11.05.2021 07:40


Chemistry, 11.05.2021 07:40

History, 11.05.2021 07:40

Health, 11.05.2021 07:40
Chemistry, 11.05.2021 07:40
Mathematics, 11.05.2021 07:40
Mathematics, 11.05.2021 07:40


