
Mathematics, 03.07.2019 20:00 cathyjuan
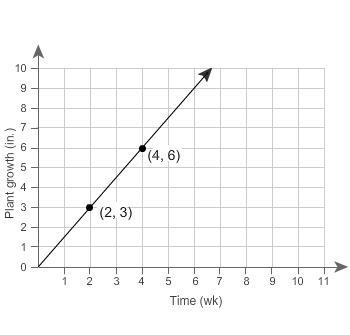
Relationship b has a lesser rate than relationship a. this graph represents relationship a. what table could represent relationship b? a. time (weeks) 3 6 8 10 plant growth (in.) 4.8 9.6 12.8 16 b. time (weeks) 3 4 6 9 plant growth (in.) 6.3 8.4 12.6 18.9 c. time (weeks) 3 4 6 9 plant growth (in.) 5.4 7.2 10.8 16.2 d. time (weeks) 3 6 8 10 plant growth (in.) 2.25 4.5 6 7.5

Answers: 1


Another question on Mathematics
Mathematics, 21.06.2019 16:40
Which region represents the solution to the given system of inequalities? |-0.5x+y23 | 1.5x+ys-1 5 4 -3 -2 -1 1 2 3 4
Answers: 1
Mathematics, 21.06.2019 20:00
One hectometer is a) 1/1000 of a meter. b) 1/100 of a meter. c) 10 meters. d) 100 meters. e) 1000 meters.
Answers: 1
Mathematics, 22.06.2019 00:00
Iwill arward ! , i if bt ≅ eu , bu ≅ et , prove: ∠b ≅ ∠e. fill in the blanks: draw segment ut ≅ bt≅ bu ≅ △ubt ≅ △
Answers: 1
You know the right answer?
Relationship b has a lesser rate than relationship a. this graph represents relationship a. what tab...
Questions
Mathematics, 03.05.2021 14:00

Mathematics, 03.05.2021 14:00


Advanced Placement (AP), 03.05.2021 14:00
Mathematics, 03.05.2021 14:00


Mathematics, 03.05.2021 14:00

Biology, 03.05.2021 14:00

English, 03.05.2021 14:00
English, 03.05.2021 14:00
English, 03.05.2021 14:00
English, 03.05.2021 14:00
History, 03.05.2021 14:00

Social Studies, 03.05.2021 14:00


