
Mathematics, 01.07.2019 11:00 joseroblesrivera123
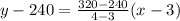
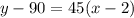
The table and the graph below each show a different relationship between the same two variables, x and y: a table with two columns and 5 rows is shown. the column head for the left column is x, and the column head for the right column is y. the row entries in the table are 3,240 and 4,320 and 5,400 and 6,480. on the right of this table is a graph. the x axis values are from 0 to 10 in increments of 2 for each grid line. the y axis values on the graph are from 0 to 450 in increments of 90 for each grid line. a line passing through the ordered pairs 2, 90 and 4, 180 and 6, 270 and 8, 360 is drawn. how much more would the value of y be in the table than its value on the graph when x = 11? 110 150 385 450

Answers: 1


Another question on Mathematics
Mathematics, 21.06.2019 17:30
Use the net as an aid to compute the surface area of the triangular prism. a) 550 m2 b) 614 m2 c) 670 m2 d) 790 m2
Answers: 1
Mathematics, 21.06.2019 18:00
The los angels ram scored 26, 30, 48, and 31 pts in their last four games. how many pts do they need to score in super bowl liii in order to have an exact mean average of 35 pts over five games. write and solve and equation. use x to represent the 5th game.
Answers: 1
Mathematics, 21.06.2019 20:10
What additional information could be used to prove abc =mqr using sas? check all that apply.
Answers: 1
You know the right answer?
The table and the graph below each show a different relationship between the same two variables, x a...
Questions


Law, 26.07.2021 20:10
Mathematics, 26.07.2021 20:10
Mathematics, 26.07.2021 20:10
Mathematics, 26.07.2021 20:10
Mathematics, 26.07.2021 20:10
Mathematics, 26.07.2021 20:10

Chemistry, 26.07.2021 20:10

Physics, 26.07.2021 20:10


History, 26.07.2021 20:10

Mathematics, 26.07.2021 20:10

Medicine, 26.07.2021 20:10
Mathematics, 26.07.2021 20:10
Biology, 26.07.2021 20:10


