
Mathematics, 01.07.2019 01:00 Delgadojacky0206
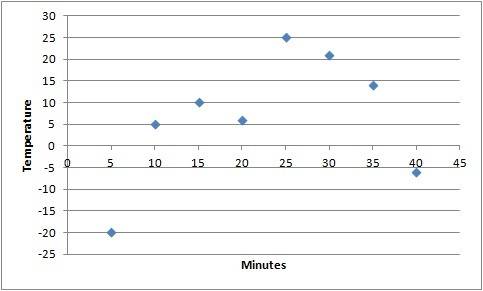
Suppose you are going to graph the data in the table. minutes temperature (°c) 5 -20 10 5 15 10 20 6 25 25 30 21 35 14 40 -6 what data should be represented on each axis, and what should the axis increments be? x-axis: minutes in increments of 5; y-axis: temperature in increments of 1 x-axis: minutes in increments of 5; y-axis: temperature in increments of 5 x-axis: temperature in increments of 5; y-axis: minutes in increments of 1 x-axis: temperature in increments of 1; y-axis: minutes in increments of 5

Answers: 1


Another question on Mathematics
Mathematics, 21.06.2019 18:00
Use the data on the dot plot to answer the question.how many people read for more than three hours last week? i'm on a unit test review
Answers: 1
Mathematics, 21.06.2019 19:10
What is the absolute value of the complex number -4-sqrt2i
Answers: 2
Mathematics, 21.06.2019 23:40
What is the equation, in point-slope form, of the line that has a slope of 6 and passes through the point (–1, –8)? a. y+8 = 6 (x+1 )
Answers: 1
Mathematics, 22.06.2019 00:10
Sasha delivers newspapers to subscribers that live within a 4 block radius of her house. sasha's house is located at point (0, -1). points a, b, c, d, and e represent the houses of some of the subscribers to the newspaper. to which houses does sasha deliver newspapers?
Answers: 1
You know the right answer?
Suppose you are going to graph the data in the table. minutes temperature (°c) 5 -20 10 5 15 10 20 6...
Questions


Biology, 02.03.2020 18:20
Mathematics, 02.03.2020 18:20


