
Mathematics, 30.06.2019 05:00 noobgirlaskthequest
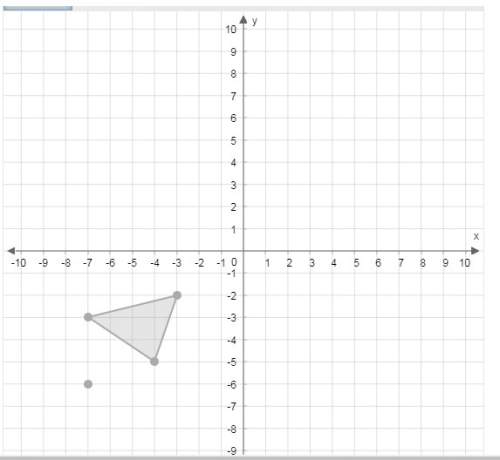
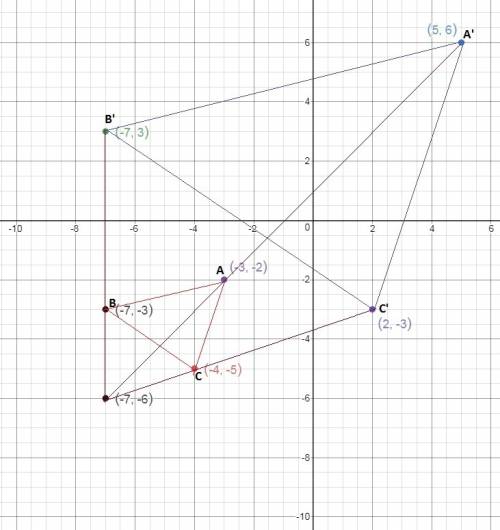
Pls ! graph the image of this figure after a dilation with a scale factor of 3 centered at (−7, −6) . use the polygon tool to graph the dilated figure.

Answers: 2


Another question on Mathematics
Mathematics, 21.06.2019 13:00
There is a line with slope 1/a going through the point (a, a²). find the equation of the line perpendicular to this line at this point. (don’t let this problem intimidate you! solve the problem as you would if i’d given you specific values. just use variables instead.)
Answers: 2
Mathematics, 21.06.2019 15:40
The data represents the semester exam scores of 8 students in a math course. {51,91,46,30,36,50,73,80} what is the five-number summary?
Answers: 1
Mathematics, 21.06.2019 20:00
15m is what percent of 60m; 3m; 30m; 1.5 km? the last one is km not m
Answers: 1
Mathematics, 21.06.2019 22:30
Which of the functions below could have created this graph?
Answers: 1
You know the right answer?
Pls ! graph the image of this figure after a dilation with a scale factor of 3 centered at (−7, −6)...
Questions

English, 14.11.2020 20:20

History, 14.11.2020 20:30
SAT, 14.11.2020 20:30
Mathematics, 14.11.2020 20:30
Mathematics, 14.11.2020 20:30

Advanced Placement (AP), 14.11.2020 20:30

Mathematics, 14.11.2020 20:30
Mathematics, 14.11.2020 20:30
Mathematics, 14.11.2020 20:30
Mathematics, 14.11.2020 20:30


