Mathematics, 29.06.2019 01:30 tmiller2862
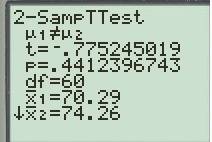
The following table gives results from two groups of students who took a nonproctored test. use a 0.01 significance level to test the claim that the samples are from populations with the same mean. group 1: n=30 mean=70.29 s=22.09 group 2: n=32 mean=74.26 s=18.15 original claim: opposite claim: alternative and null hypotheses: significance level: test statistic: p-value: reject or fail to reject: final conclusion:

Answers: 1


Another question on Mathematics

Mathematics, 21.06.2019 15:00
Aformual for 8 bottles of window cleaner calls for 6 cups of rubbing to customers alcohol 2 1/4 gallons of water and 1 1/2 cups of ammonia alcohol would the forula call if a factory made 1,280 bottles for stores to sell to customers
Answers: 1

Mathematics, 21.06.2019 16:30
Amuffin recipe, which yields 12 muffins, calls for cup of milk for every 1 cups of flour. the same recipe calls for cup of coconut for every cup of chopped apple. to yield a batch of 30 muffins, how much flour will be needed in the mix?
Answers: 1

Mathematics, 21.06.2019 19:00
What is the best way to answer questions with a x expression in the question. for example 3x + 10x=?
Answers: 1

Mathematics, 21.06.2019 19:30
Bob is putting books on a shelf and takes a break after filling 18 1/2 inches on the book shelf. the book shelf is now 2/3 full. how long is the entire bookshelf?
Answers: 2
You know the right answer?
The following table gives results from two groups of students who took a nonproctored test. use a 0....
Questions


Mathematics, 30.07.2020 23:01


English, 30.07.2020 23:01


Mathematics, 30.07.2020 23:01


Mathematics, 30.07.2020 23:01


Mathematics, 30.07.2020 23:01

Computers and Technology, 30.07.2020 23:01


Mathematics, 30.07.2020 23:01


