
Mathematics, 28.06.2019 20:30 k3rbycalilung
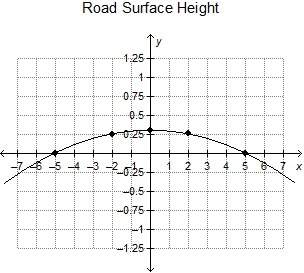
The quadratic regression graphed on the coordinate grid represents the height of a road surface x meters from the center of the road. what does the graph of the regression model show? the height of the surface decreases from the center out to the sides of the road. the height of the surface increases, then decreases, from the center out to the sides of the road. the height of the surface increases from the center out to the sides of the road. the height of the surface remains the same the entire distance across the road.

Answers: 1

![(0,5]](/tpl/images/0028/4273/bb442.png)


Another question on Mathematics
Mathematics, 21.06.2019 19:30
At the electronics store you have a coupon for 20% off up to 2 cds you buy for cds with the original cost of $10.99 each the sales tax is 5% what is the total cost of your purchase
Answers: 1
Mathematics, 21.06.2019 23:00
In an equilateral triangle, each angle is represented by 5y+3. what is the value of y? a. 9.7 b. 10.8 c. 11.4 d. 7.2
Answers: 1
Mathematics, 22.06.2019 00:00
In a timed typing test lara typed 63 words per minute.estimate the number of words she should be able to type in half in hour show your work
Answers: 2
You know the right answer?
The quadratic regression graphed on the coordinate grid represents the height of a road surface x me...
Questions


Mathematics, 15.04.2020 01:30


Computers and Technology, 15.04.2020 01:30
Engineering, 15.04.2020 01:30

Mathematics, 15.04.2020 01:30
Business, 15.04.2020 01:30
Mathematics, 15.04.2020 01:30
Mathematics, 15.04.2020 01:30


