
Mathematics, 28.06.2019 09:00 LindaCat78
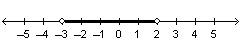
The solution to an absolute value inequality is shown on the graph below. what is another way to show the solution? x > –3 or x < 2{x|x< -3 or x< 2}[–3, 2](–3, 2)

Answers: 1


Another question on Mathematics
Mathematics, 21.06.2019 18:30
Which value would be a solution for x in the inequality 47-4x< 7
Answers: 1
Mathematics, 21.06.2019 20:40
What is the probability of throwing several dice with sum equal to 6 (six)? show the ways of possibilities for sum 6 (as the numerator) and the ways of throwing n dices for n = 1, 2, 3, 4 or 5 as denominator for all the questions to earn full credits. (a)throw one die, (b) throw two dice, (c) throw three dice (d) throw 4 dice, (e) throw 5 dice
Answers: 3
Mathematics, 21.06.2019 23:40
20 ! jason orders a data set from least to greatest. complete the sentence by selecting the correct word from each drop-down menu. the middle value of the data set is a measure and is called the part a: center b: spread part b: mean a: mean absolute deviation b: median c: range
Answers: 1
Mathematics, 22.06.2019 00:00
(20 points) a bank has been receiving complaints from real estate agents that their customers have been waiting too long for mortgage confirmations. the bank prides itself on its mortgage application process and decides to investigate the claims. the bank manager takes a random sample of 20 customers whose mortgage applications have been processed in the last 6 months and finds the following wait times (in days): 5, 7, 22, 4, 12, 9, 9, 14, 3, 6, 5, 15, 10, 17, 12, 10, 9, 4, 10, 13 assume that the random variable x measures the number of days a customer waits for mortgage processing at this bank, and assume that x is normally distributed. 2a. find the sample mean of this data (x ě…). 2b. find the sample variance of x. find the variance of x ě…. for (c), (d), and (e), use the appropriate t-distribution 2c. find the 90% confidence interval for the population mean (îľ). 2d. test the hypothesis that îľ is equal to 7 at the 95% confidence level. (should you do a one-tailed or two-tailed test here? ) 2e. what is the approximate p-value of this hypothesis?
Answers: 2
You know the right answer?
The solution to an absolute value inequality is shown on the graph below. what is another way to sho...
Questions


History, 30.07.2021 17:30

Biology, 30.07.2021 17:30

Chemistry, 30.07.2021 17:30

Computers and Technology, 30.07.2021 17:30


Geography, 30.07.2021 17:50


