
Mathematics, 27.06.2019 15:00 msjuly723
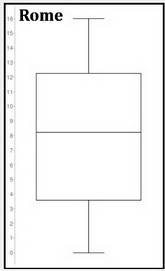
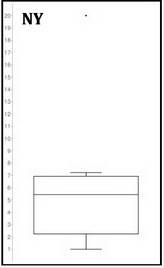
The table shows data from a survey about the number of times families eat at restaurants during a week. the families are either from rome, italy or new york, new york: maximum minimum q1 q3 iqr median mean σ rome 16 0 3 13 10 8.5 8 5.4 new york 20 1 4.5 6 1.5 5.5 7.25 5.4 which of the choices below best describes how to measure the center of this data? both centers are best described with the mean. both centers are best described with the median. the rome data center is best described by the mean. the new york data center is best described by the median. the rome data center is best described by the median. the new york data center is best described by the mean.

Answers: 1


Another question on Mathematics
Mathematics, 21.06.2019 16:00
Sam makes his sales calls according to a pattern. he travels either north or south depending on the calendar. some of his past trips were as follows: on february 17, april 24, june 10, september 19, and november 3 he drove north. on february 28, may 25, august 22, november 20, and december 18, he drove south. describe sams' pattern. in which direction will sam drive on oct4 and oct 24?
Answers: 1
Mathematics, 21.06.2019 19:30
Ariel is working at a meat packing plant for 5 nights a week. her regular wage is $11 an hour. she earns tine and a half for any overtime hours. this week she worked 9 hours of over time .how much will ariel earn for overtime this week ?
Answers: 1
Mathematics, 21.06.2019 19:50
98 point question what is the record for most points in one
Answers: 2
You know the right answer?
The table shows data from a survey about the number of times families eat at restaurants during a we...
Questions

Mathematics, 26.07.2020 01:01

English, 26.07.2020 01:01

Mathematics, 26.07.2020 01:01
Mathematics, 26.07.2020 01:01
Mathematics, 26.07.2020 01:01
Mathematics, 26.07.2020 01:01


Computers and Technology, 26.07.2020 01:01
Mathematics, 26.07.2020 01:01
Mathematics, 26.07.2020 01:01
Biology, 26.07.2020 01:01
Mathematics, 26.07.2020 01:01

Mathematics, 26.07.2020 01:01


