
Mathematics, 26.06.2019 23:00 Kin90ful
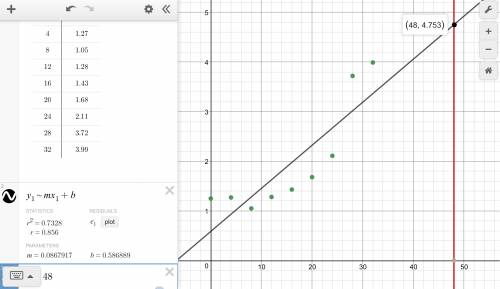
You research the cost of a gallon of gasoline over several years to look for a trend. the table shows your data. the line of best fit uses years since 1980 as the input value. what is a line of best fit for the data? based upon these prices, how much would you expect to pay in 2028? year: 1980, 1984, 1988, 1992, 1996, 2000, 2004, 2008, 2012 price/gallon: $1.25, $1.27, $1.05, $1.28, $1.43, $1.68, $2.11, $3.72, $3.99 a.) y= 0.087x+2.26; $6.44 b.) y= 0.087x+0.587; $4.76 c.) y= 0.134x+1.25; $7.68 d.) y= 0.0347x+0.856; $2.52

Answers: 1


Another question on Mathematics
Mathematics, 21.06.2019 13:10
Aphoto of a painting measured 13 x 17 inches the scale of the photo to the original painting is 1 inch to 3 inches. what is the size of this painting
Answers: 1
Mathematics, 21.06.2019 19:30
If 2(a^2+b^2)=(a+b)^2 then, > a+b=0, > ab=0, > a=b, > 2a=b
Answers: 1
You know the right answer?
You research the cost of a gallon of gasoline over several years to look for a trend. the table show...
Questions


History, 06.05.2020 20:25

Geography, 06.05.2020 20:25


Physics, 06.05.2020 20:25

English, 06.05.2020 20:25


