
Mathematics, 26.06.2019 21:30 eddyy5900
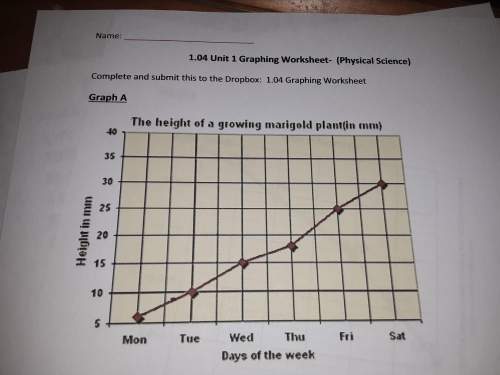
1. what is the independent variable in this graph? 2. list the range of the dependent variable values.3. explain how to intercept the data for this graph. (what is happening to the height of q growing marigold during this week? )i need asapits physical science

Answers: 1


Another question on Mathematics
Mathematics, 21.06.2019 17:00
In a sample of 2023 u.s. adults, 373 said franklin roosevelt was the best president since world war ii. two u.s. adults are selected at random from the population of all u.s. adults without replacement. assuming the sample is representative of all u.s. adults, complete parts (a) through (d). (a) find the probability that both adults say franklin roosevelt was the best president since world war ii. the probability that both adults say franklin roosevelt was the best president since world war ii is (round to three decimal places as needed.) (b) find the probability that neither adult says franklin roosevelt was the best president since world war ii. the probability that neither adult says franklin roosevelt was the best president since world war ii is (round to three decimal places as needed.) (c) find the probability that at least one of the two adults says franklin roosevelt was the best president since world war ii. the probability that at least one of the two adults says franklin roosevelt was the best president since world war ii is (round to three decimal places as needed.) (d) which of the events can be considered unusual? explain. select all that apply. the event in part left parenthesis a right parenthesis is unusual because its probability is less than or equal to 0.05. the event in part (b) is unusual because its probability is less than or equal to 0.05. none of these events are unusual. the event in part (c) is unusual because its probability is less than or equal to 0.05.
Answers: 3
Mathematics, 21.06.2019 18:30
The border line of the linear inequality 4x + 7y < 5 is dotted true or false?
Answers: 2
Mathematics, 21.06.2019 18:30
Use the four functions below for this question. compare and contrast these four functions using complete sentences focus on the slope and y- intercept first, and then on any additional properties of each function
Answers: 3
Mathematics, 21.06.2019 22:00
Percent increase and decrease. original number: 45 new number: 18
Answers: 1
You know the right answer?
1. what is the independent variable in this graph? 2. list the range of the dependent variable value...
Questions

Physics, 29.03.2020 17:07

Health, 29.03.2020 17:07
Mathematics, 29.03.2020 17:07
Mathematics, 29.03.2020 17:07
Mathematics, 29.03.2020 17:07


Biology, 29.03.2020 17:08

English, 29.03.2020 17:08

Chemistry, 29.03.2020 17:08
Mathematics, 29.03.2020 17:08
Mathematics, 29.03.2020 17:09

History, 29.03.2020 17:09


