
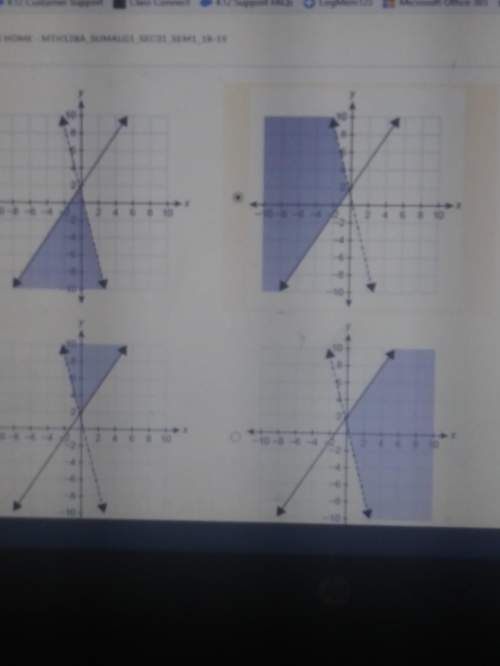
What graph represents the system of linear inequalities? 4x+y> 1y≤3/2x+2
...

Mathematics, 24.06.2019 23:00 dondre54
What graph represents the system of linear inequalities? 4x+y> 1y≤3/2x+2

Answers: 1


Another question on Mathematics
Mathematics, 21.06.2019 13:00
#12 find the value of x. #13 find the value of the variable.
Answers: 3
Mathematics, 21.06.2019 16:40
Which data set has a greater spread? why? set a: {38, 12, 23, 48, 55, 16, 18} set b: {44, 13, 24, 12, 56} has a greater spread because .
Answers: 2
Mathematics, 21.06.2019 17:40
The weight of full–grown tomatoes at a farm is modeled by a normal distribution with a standard deviation of 18.4 grams. the 95 percent confidence interval for the mean weight of the tomatoes is calculated using a sample of 100 tomatoes. what is the margin of error (half the width of the confidence interval)?
Answers: 2
Mathematics, 21.06.2019 19:30
What are the solutions to the following equation? |m| = 8.5 the value of m is equal to 8.5 and because each distance from zero is 8.5.
Answers: 3
You know the right answer?
Questions


Mathematics, 01.12.2020 01:00

Biology, 01.12.2020 01:00
Mathematics, 01.12.2020 01:00
Mathematics, 01.12.2020 01:00
Mathematics, 01.12.2020 01:00
Mathematics, 01.12.2020 01:00

Arts, 01.12.2020 01:00
Mathematics, 01.12.2020 01:00

Advanced Placement (AP), 01.12.2020 01:00


