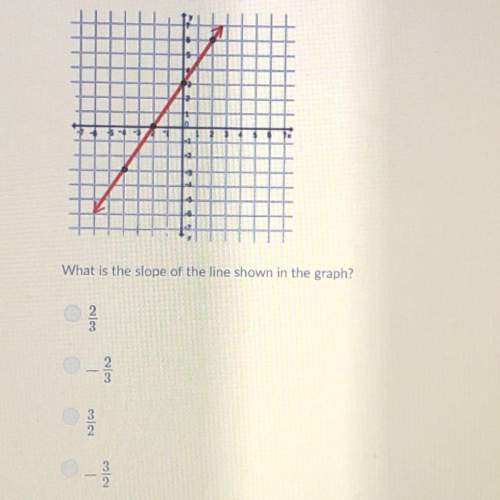
What is the slope of the line shown in the graph? a. 2/3 b. -2/3 c. 3/2 d. -3/2
...

Mathematics, 24.06.2019 03:00 sciencecreation87
What is the slope of the line shown in the graph? a. 2/3 b. -2/3 c. 3/2 d. -3/2

Answers: 2


Another question on Mathematics
Mathematics, 21.06.2019 23:00
Someone answer this asap for the function f(x) and g(x) are both quadratic functions. f(x) = x² + 2x + 5 g(x) = x² + 2x - 1 which statement best describes the graph of g(x) compared to the graph of f(x)? a. the graph of g(x) is the graph of f(x) shifted down 1 units. b. the graph of g(x) is the graph of f(x) shifted down 6 units. c. the graph of g(x) is the graph of f(x) shifted to the right 1 unit. d. the graph of g(x) is the graph of f(x) shifted tothe right 6 units.
Answers: 3
Mathematics, 22.06.2019 03:40
Assume that females have pulse rates that are normally distributed with a mean of mu equals 72.0 beats per minute and a standard deviation of sigma equals 12.5 beats per minute. complete parts (a) through (c) below. a. if 1 adult female is randomly selected, find the probability that her pulse rate is between 65 beats per minute and 79 beats per minute. the probability is? b. if 16 adult females are randomly selected, find the probability that they have pulse rates with a mean between 65 beats per minute and 79 beats per minute. the probability is? c. why can the normal distribution be used in part (b), even though the sample size does not exceed 30?
Answers: 3
Mathematics, 22.06.2019 03:50
Acertain group of women has a 0.640.64% rate of red/green color blindness. if a woman is randomly selected, what is the probability that she does not have red/green color blindness? what is the probability that the woman selected does not have red/green color blindness? nothing (type an integer or a decimal. do not round.)
Answers: 1
Mathematics, 22.06.2019 04:00
1.what effect does replacing x with x−4 have on the graph for the function f(x) ? f(x)=|x−6|+2 the graph is shifted 4 units up. the graph is shifted 4 units down. the graph is shifted 4 units left. the graph is shifted 4 units right. 2.what are the coordinates of the hole in the graph of the function f(x) ? f(x)=x^2+3x−28/x+7 3.which graph represents the function?
Answers: 2
You know the right answer?
Questions


History, 28.01.2020 09:31

Biology, 28.01.2020 09:31

Social Studies, 28.01.2020 09:31

Mathematics, 28.01.2020 09:31
Mathematics, 28.01.2020 09:31

Chemistry, 28.01.2020 09:31
Mathematics, 28.01.2020 09:31

Geography, 28.01.2020 09:31
History, 28.01.2020 09:31
Biology, 28.01.2020 09:31
Social Studies, 28.01.2020 09:31


