
Mathematics, 22.06.2019 20:00 sarn8899
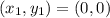
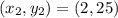
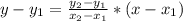
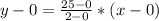
The graph below shows the prices of different numbers of boots at a store: a graph is shown. the values on the x axis are 0, 2, 4, 6, 8, and 10. the values on the y axis are 0, 25, 50, 75, 100, and 125. points are shown on ordered pairs 0, 0 and 2, 25 and 4, 50 and 6, 75 and 8, 100. these points are connected by a line. the label on the x axis is number of boots. the title on the y axis is price in dollars. which equation can be used to determine p, the cost of b boots? p = 12.50b p = 25b b = 25p b = 12.50p

Answers: 1


Another question on Mathematics
Mathematics, 21.06.2019 17:40
The graph of h(x)= |x-10| +6 is shown. on which interval is this graph increasing
Answers: 2
Mathematics, 21.06.2019 19:30
Agarden consists of an apple tree, a pear tree, cauliflowers, and heads of cabbage. there are 40 vegetables in the garden. 24 of them are cauliflowers. what is the ratio of the number of cauliflowers to the number of heads of cabbage?
Answers: 2
Mathematics, 21.06.2019 22:30
Factor the polynomial, if possible. if the polynomial cannot be factored, write prime. 9n^3 + 27n^2 – 25n – 75
Answers: 2
You know the right answer?
The graph below shows the prices of different numbers of boots at a store: a graph is shown. the va...
Questions
Mathematics, 27.09.2020 07:01

History, 27.09.2020 07:01

History, 27.09.2020 07:01

Spanish, 27.09.2020 07:01

Mathematics, 27.09.2020 07:01

Chemistry, 27.09.2020 07:01
Mathematics, 27.09.2020 07:01
Mathematics, 27.09.2020 07:01
Chemistry, 27.09.2020 07:01

Advanced Placement (AP), 27.09.2020 07:01
Mathematics, 27.09.2020 07:01

Mathematics, 27.09.2020 07:01


