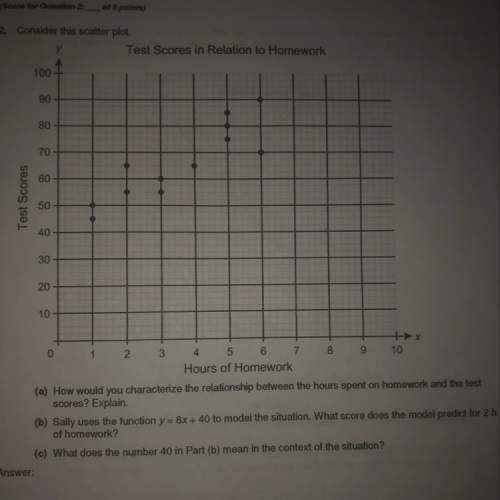
Consider this scatter plot.
(a) how would you characterize the relationship between the hours...

Mathematics, 22.09.2019 19:30 carlinryan
Consider this scatter plot.
(a) how would you characterize the relationship between the hours spent on homework and the test scores? explain.
(b) sally uses the function y = 8x + 40 to model the situation. what score does the model predict for 2 h of homework?
(c) what does the number 40 in part (b) mean in the context of the situation?

Answers: 1


Another question on Mathematics
Mathematics, 21.06.2019 13:00
Which measurement is the most precise? a) 29 cm b) 28.8 cm eliminate c) 28.76 cm d) 28.762 cm
Answers: 2
Mathematics, 21.06.2019 20:00
A. what does the point (4, 122) represent? b. what is the unit rate? c. what is the cost of buying 10 tickets?
Answers: 2
Mathematics, 21.06.2019 22:30
What is the least common multiple for 6 and 8? what is the least common multiple for 4 and 12 ? what is the least common multiple for 11 and 12? what is the least common multiple for 3 and 6?
Answers: 1
Mathematics, 22.06.2019 04:00
Identify reflection rule on a coordinate plane that verifies that triangle a(-1,7), b(6,5), c(-2,2) and a’(-1,-7), b(6,-5), c’(-2,2) triangle are congruent when reflected over the x-axis
Answers: 1
You know the right answer?
Questions

Arts, 08.08.2021 04:10

Social Studies, 08.08.2021 04:10

Mathematics, 08.08.2021 04:10

English, 08.08.2021 04:20
Mathematics, 08.08.2021 04:20

Biology, 08.08.2021 04:20
Biology, 08.08.2021 04:20

Biology, 08.08.2021 04:20
Biology, 08.08.2021 04:20
Biology, 08.08.2021 04:20


