


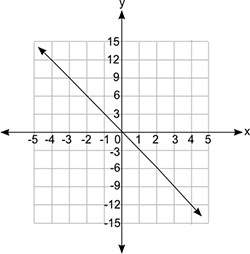
Which equation does the graph below represent? (1 point)
a coordinate grid is shown. th...

Mathematics, 30.01.2020 01:04 bettylou12504
Which equation does the graph below represent? (1 point)
a coordinate grid is shown. the x-axis values are from negative 5 to positive 5 in increments of 1 for each grid line, and the y-axis values are from negative 15 to positive 15 in increments of 3 for each grid line. a line is shown passing through the ordered pairs negative 4, 12 and 0, 0 and 4, negative 12.
y = fraction negative 1 over 3x
y = −3x
y = 3x
y = fraction 1 over 3x

Answers: 3


Another question on Mathematics
Mathematics, 21.06.2019 14:30
Write the system of equations represented by the matrix. 0 1 2 4 -2 3 6 9 1 0 1 3
Answers: 2
Mathematics, 22.06.2019 04:30
Solve the following system algebraically. y = x2 – 9x + 18 y = x – 3 a. (3,1) and (5,3) b. (3,0) and ( 4,2) c. (–4,5) and (7,–10) d. (7,4) and (3,0)
Answers: 3
Mathematics, 22.06.2019 05:00
Write an eqautoin of the line that passes through the give points -3,-2 and 2,-1
Answers: 2
You know the right answer?
Questions
Mathematics, 05.10.2019 11:30
Mathematics, 05.10.2019 11:30


English, 05.10.2019 11:30

Biology, 05.10.2019 11:30

French, 05.10.2019 11:30

Geography, 05.10.2019 11:30

History, 05.10.2019 11:30
History, 05.10.2019 11:30

Social Studies, 05.10.2019 11:30
Biology, 05.10.2019 11:30
Mathematics, 05.10.2019 11:30


