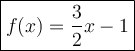
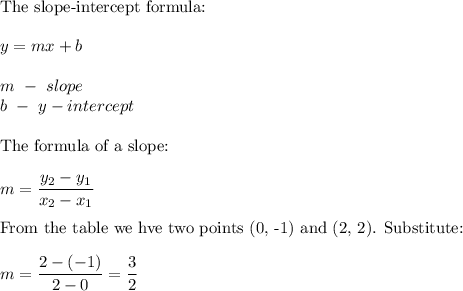
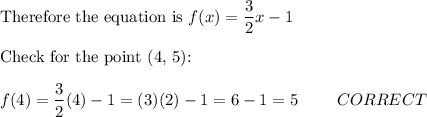
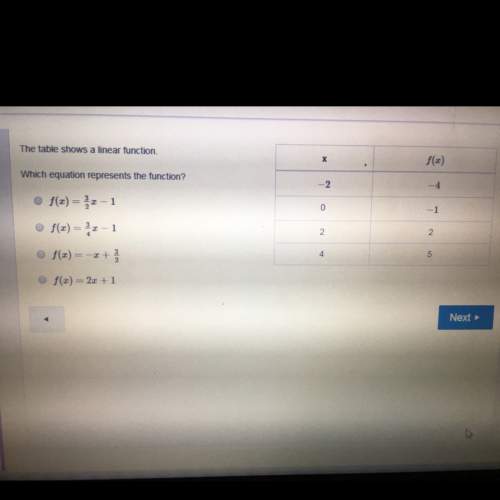
The table shows a linear function.
which equation represents the function.
...

Mathematics, 28.09.2019 04:40 adrian128383
The table shows a linear function.
which equation represents the function.

Answers: 1


Another question on Mathematics
Mathematics, 21.06.2019 18:30
The median of a data set is the measure of center that is found by adding the data values and dividing the total by the number of data values that is the value that occurs with the greatest frequency that is the value midway between the maximum and minimum values in the original data set that is the middle value when the original data values are arranged in order of increasing (or decreasing) magnitude
Answers: 3
Mathematics, 21.06.2019 20:10
The population of a small rural town in the year 2006 was 2,459. the population can be modeled by the function below, where f(x residents and t is the number of years elapsed since 2006. f(t) = 2,459(0.92)
Answers: 1
Mathematics, 22.06.2019 00:00
The function y= x - 4x+ 5 approximates the height, y, of a bird, and its horizontal distance, x, as it flies from one fence post to another. all distances are in feet. complete the square to find and interpret the extreme value (vertex). select two answers: one extreme value and one interpretation.
Answers: 2
Mathematics, 22.06.2019 00:30
Graph the line y=4/3 x+1 . use the line tool and select two points on the line.
Answers: 1
You know the right answer?
Questions
Mathematics, 23.11.2021 01:00
Mathematics, 23.11.2021 01:00
Mathematics, 23.11.2021 01:00
Mathematics, 23.11.2021 01:00
Mathematics, 23.11.2021 01:00
Mathematics, 23.11.2021 01:00
Mathematics, 23.11.2021 01:00

Social Studies, 23.11.2021 01:00

Mathematics, 23.11.2021 01:00
Mathematics, 23.11.2021 01:00

Chemistry, 23.11.2021 01:00
Mathematics, 23.11.2021 01:00


Mathematics, 23.11.2021 01:00


