Option D (2, 6)
Step-by-step explanation:
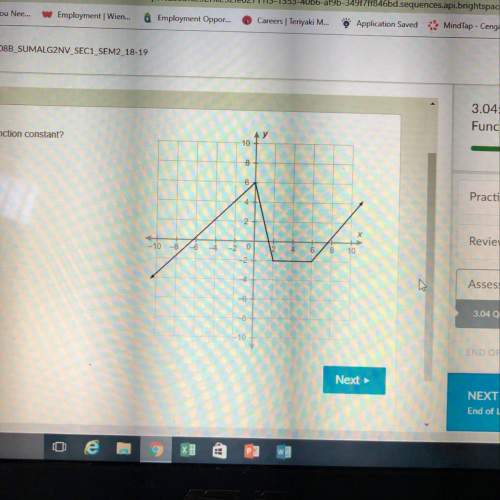
As shown in the graph function has four intervals on which graph is plotted.
1). From the graph we can see in the interval -10 ≤ x ≤ 0 graph is increasing.
2). From 0 ≤ x ≤ 2 function is decreasing.
3). Between 2 ≤ x ≤ 6 function is constant.
4). And for x ≥ 6 function is increasing.
Therefore interval in which the function is constant is (2, 6).