Which data set could not be represented by the box plot shown?
a) {13, 5, 8, 8, 6, 10, 15, 12...

Mathematics, 29.01.2020 07:52 brooklyn4932
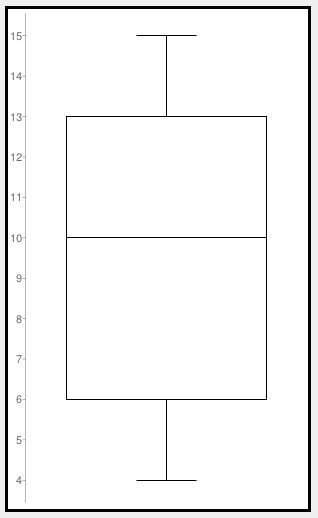
Which data set could not be represented by the box plot shown?
a) {13, 5, 8, 8, 6, 10, 15, 12, 4, 13, 11}
b) {2, 10, 13, 7, 9, 5, 15, 12, 7, 13, 11}
c) {15, 13, 6, 7, 10, 8, 11, 13, 13, 6, 4}
d) {4, 13, 6, 7, 15, 12, 11, 10, 5, 13, 9}

Answers: 3


Another question on Mathematics
Mathematics, 21.06.2019 14:00
Complete the truth table a. t, f, f, t b. t f f f c. f t f t d f t f t
Answers: 1
Mathematics, 21.06.2019 17:00
Given f(x)=2x^2-8x+6 and g(x)=3x-1 find f(x) +g(x) a. 2x^2+5x+5 b.2x^2-11x+7 c. 2x^2-5x+5 d.2x^2-5x-5
Answers: 1
Mathematics, 21.06.2019 17:00
Use the frequency distribution, which shows the number of american voters (in millions) according to age, to find the probability that a voter chosen at random is in the 18 to 20 years old age range. ages frequency 18 to 20 5.9 21 to 24 7.7 25 to 34 20.4 35 to 44 25.1 45 to 64 54.4 65 and over 27.7 the probability that a voter chosen at random is in the 18 to 20 years old age range is nothing. (round to three decimal places as needed.)
Answers: 1
Mathematics, 21.06.2019 17:30
Astudent survey asked: "how tall are you (in inches)? " here's the data: 67, 72, 73, 60, 65, 86, 72, 69, 74 give the five number summary. a. median: 73, mean: 70.89, iqr: 5, min: 60, max: 74 b. 60, 66, 72, 73.5, 86 c. 60, 67, 72, 73, 74 d. 0, 60, 70, 89, 74, 100
Answers: 3
You know the right answer?
Questions


Computers and Technology, 29.07.2020 05:01
Mathematics, 29.07.2020 05:01

Biology, 29.07.2020 05:01


English, 29.07.2020 05:01


