
Mathematics, 06.01.2020 15:31 451jonmcco
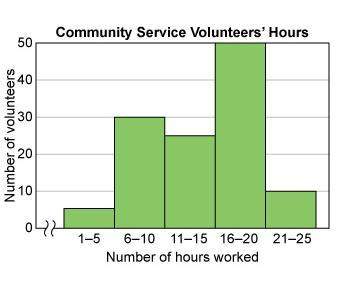
This histogram shows the numbers of people who volunteered for community service and the number of hours they worked.
how many volunteers worked no more than 10 hours?
a.30
b.35
c.55
d.

Answers: 3


Another question on Mathematics
Mathematics, 21.06.2019 14:40
Which graph represents the following piecewise defined function?
Answers: 2
Mathematics, 21.06.2019 17:00
In triangle opq right angled at p op=7cm,oq-pq=1 determine the values of sinq and cosq
Answers: 1
Mathematics, 21.06.2019 18:30
You were told that the amount of time lapsed between consecutive trades on the new york stock exchange followed a normal distribution with a mean of 15 seconds. you were also told that the probability that the time lapsed between two consecutive trades to fall between 16 to 17 seconds was 13%. the probability that the time lapsed between two consecutive trades would fall below 13 seconds was 7%. what is the probability that the time lapsed between two consecutive trades will be between 14 and 15 seconds?
Answers: 3
You know the right answer?
This histogram shows the numbers of people who volunteered for community service and the number of h...
Questions


History, 03.11.2020 06:10

Biology, 03.11.2020 06:10

Mathematics, 03.11.2020 06:10
History, 03.11.2020 06:10
Mathematics, 03.11.2020 06:10
Mathematics, 03.11.2020 06:10
Mathematics, 03.11.2020 06:10

Chemistry, 03.11.2020 06:10

SAT, 03.11.2020 06:10
Mathematics, 03.11.2020 06:10

Arts, 03.11.2020 06:10

Geography, 03.11.2020 06:10
Mathematics, 03.11.2020 06:10


