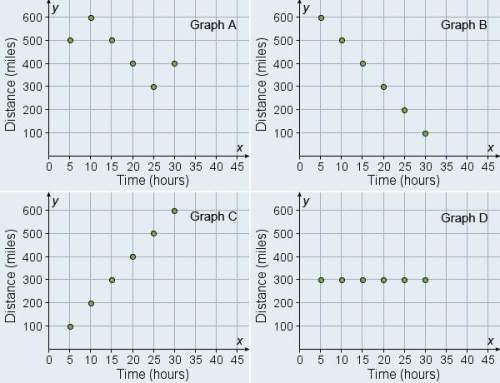
We know that at t = 0, we will have gone no distance
(0,0)
At 1 hour
d = 20*1
d =20
(1,20)
At 5 hours
d = 20*5
d =100
(5,100)
As time increases, distance increases
The only graph that increases with time is Graph C
Answer from: Quest
step- i d k and i d c : )
you: : 0
bye
Answer from: Quest
50- 250 is correct i did that one too
step-by-step explanation:
Another question on Mathematics
Mathematics, 21.06.2019 14:10
Rachel reads 1/5 of the pages of a book plus 12 pages on the first day. on the second day, she reads 1/4 of the remaining pages plus 15 pages. on the third day, she reads 1/3 of the remaining pages plus 18 pages. on the fourth day, she reads the remaining 70 pages. how many total pages are in the book?
The random variable x is the number of occurrences of an event over an interval of ten minutes. it can be assumed that the probability of an occurrence is the same in any two-time periods of an equal length. it is known that the mean number of occurrences in ten minutes is 5.3. the appropriate probability distribution for the random variable
No commitments. Cancel anytime. All pricing is in US dollars (USD). The subscriptoin renews automaticaly until you cancel. For more information read our Terms of use & Privacy Policy