Mathematics, 28.01.2020 18:08 jermainedwards
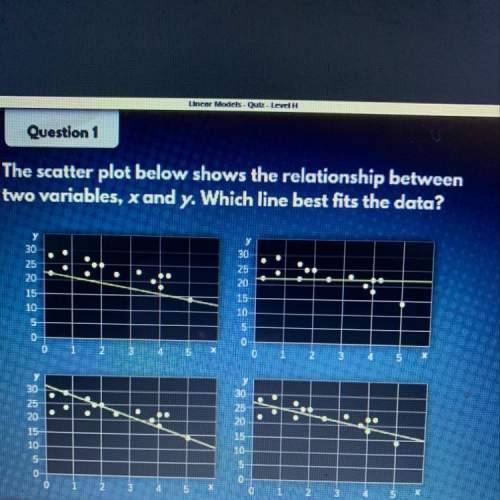
The scatter plot below shows the relationship between two variables, x and y. which line best fits the data


Answers: 1


Another question on Mathematics

Mathematics, 21.06.2019 18:00
Henry is an avid reader, he devours 90 pages in half an hour how many pages has henry read per minute?
Answers: 1

Mathematics, 21.06.2019 19:30
Factor the following expression. 27y3 – 343 a. (3y + 7)(9y2 + 2ly + 49) b. (3y – 7)(9y2 + 2ly + 49) c. (3y – 7)(932 – 217 + 49) d. (3y + 7)(92 – 2ly + 49)
Answers: 1

Mathematics, 21.06.2019 20:00
The two cylinders are similar. if the ratio of their surface areas is 9/1.44 find the volume of each cylinder. round your answer to the nearest hundredth. a. small cylinder: 152.00 m3 large cylinder: 950.02 m3 b. small cylinder: 972.14 m3 large cylinder: 12,924.24 m3 c. small cylinder: 851.22 m3 large cylinder: 13,300.25 m3 d. small cylinder: 682.95 m3 large cylinder: 13,539.68 m3
Answers: 2

Mathematics, 21.06.2019 21:40
Which statement is true about a number and its additive inverse? a. their product is always one. b. their sum is always one. c. they are always reciprocals of each other. d. their sum is always zero.
Answers: 1
You know the right answer?
The scatter plot below shows the relationship between two variables, x and y. which line best fits t...
Questions


Mathematics, 11.03.2021 16:40

History, 11.03.2021 16:40

Mathematics, 11.03.2021 16:40


Mathematics, 11.03.2021 16:40

English, 11.03.2021 16:40


History, 11.03.2021 16:40

Mathematics, 11.03.2021 16:40


Mathematics, 11.03.2021 16:40

English, 11.03.2021 16:40

English, 11.03.2021 16:40

Mathematics, 11.03.2021 16:40


