


this table shows the profit for a company (in millions of dollars) in different years.
...

Mathematics, 17.10.2019 14:50 daniecott
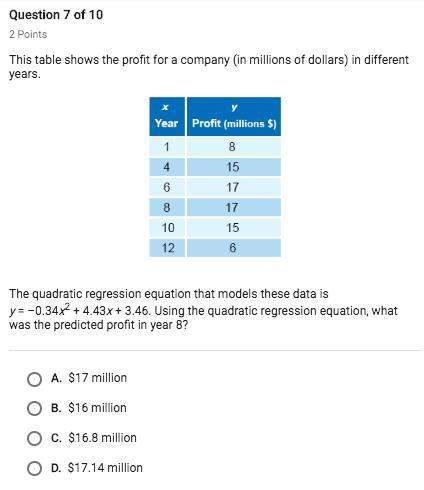
this table shows the profit for a company (in millions of dollars) in different years.
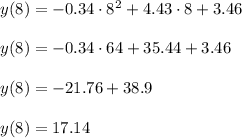
the quadratic regression equation that models these data is y = - 0.34x^2 + 4.43x + 3.46. using the quadratic regression equation, what was the predicted profit in year 8?

Answers: 1


Another question on Mathematics
Mathematics, 21.06.2019 16:30
Scale factor of 2 is used to enlarge a figure as shown below the area of is 18 in.²
Answers: 3
Mathematics, 21.06.2019 17:00
The table shows the webster family’s monthly expenses for the first three months of the year. they are $2,687.44, $2,613.09, and $2,808.64. what is the average monthly expenditure for all expenses?
Answers: 1
Mathematics, 21.06.2019 21:00
Isabel graphed the following system of equations. 2x – y = 6 y = -3x + 4 she came up with the solution (2,-2). what were the 3 steps she did to get that solution? (make sure they are in the correct order)
Answers: 2
Mathematics, 21.06.2019 21:00
Asequence has its first term equal to 4, and each term of the sequence is obtained by adding 2 to the previous term. if f(n) represents the nth term of the sequence, which of the following recursive functions best defines this sequence? (1 point) f(1) = 2 and f(n) = f(n − 1) + 4; n > 1 f(1) = 4 and f(n) = f(n − 1) + 2n; n > 1 f(1) = 2 and f(n) = f(n − 1) + 4n; n > 1 f(1) = 4 and f(n) = f(n − 1) + 2; n > 1 i will award !
Answers: 1
You know the right answer?
Questions


Social Studies, 29.10.2019 04:31

History, 29.10.2019 04:31

Biology, 29.10.2019 04:31
History, 29.10.2019 04:31

Law, 29.10.2019 04:31

Physics, 29.10.2019 04:31
Mathematics, 29.10.2019 04:31


