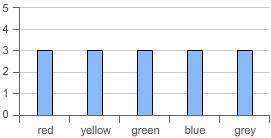
Which probability distribution table reflects the data shown in the bar graph?
(graph at the...

Mathematics, 28.01.2020 17:53 Jerrikasmith28
Which probability distribution table reflects the data shown in the bar graph?
(graph at the bottom)
x p
red 0.3
yellow 0.3
green 0.3
blue 0.3
grey 0.3
x p
red 0.1
yellow 0.2
green 0.3
blue 0.4
grey 0.5
x p
red 0.2
yellow 0.2
green 0.2
blue 0.2
grey 0.2
x p
red 0.5
yellow 0.4
green 0.3
blue 0.2
grey 0.1

Answers: 1


Another question on Mathematics
Mathematics, 21.06.2019 13:30
Ametalworker has a metal alloy that is 30? % copper and another alloy that is 55? % copper. how many kilograms of each alloy should the metalworker combine to create 90 kg of a 50? % copper? alloy?
Answers: 3
Mathematics, 21.06.2019 17:30
Which of the following is true for the relation f(x)=2x^2+1
Answers: 3
Mathematics, 21.06.2019 19:40
Molly shared a spool of ribbon with 12 people. each person received 3 feet of ribbon. which equation can she use to find r, the number of feet of ribbon that her spool originally had?
Answers: 1
Mathematics, 21.06.2019 21:00
X+y=-4 x-y=2 use elimination with adding and subtraction
Answers: 3
You know the right answer?
Questions

Computers and Technology, 27.08.2019 21:00

History, 27.08.2019 21:00


Health, 27.08.2019 21:00


Biology, 27.08.2019 21:00
Mathematics, 27.08.2019 21:00

History, 27.08.2019 21:00
English, 27.08.2019 21:00
Social Studies, 27.08.2019 21:00

Physics, 27.08.2019 21:00


