
Mathematics, 23.12.2019 14:31 cristinaledford3696
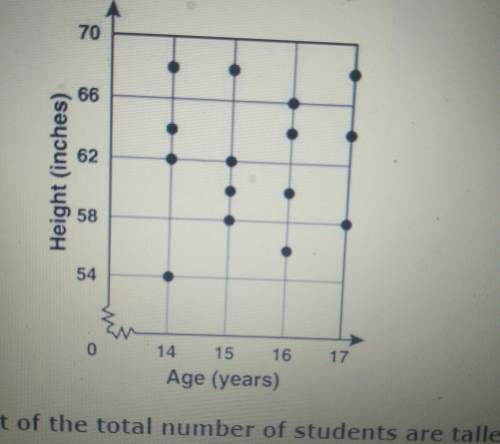
The scatter plot shows the ages snd heights of 15 students in a physical education class. according ti the scatterplot, what percent of the total of students are taller than 60 inches a.) 60% b.) 40% c. ) 73% d.)90%

Answers: 1


Another question on Mathematics
Mathematics, 21.06.2019 15:00
Solve the equation using the given values: x= -2.5; y= -7.51. 2xy + 2x²
Answers: 3
Mathematics, 21.06.2019 16:50
The table represents a linear function. what is the slope of the function? –6 –4 4 6
Answers: 3
Mathematics, 21.06.2019 17:00
Evaluate the expression for the given value of the variable 7a - 4a for a =8
Answers: 2
Mathematics, 21.06.2019 22:00
If my mom gets $13.05 an hour, and she works from 3: 30 to 10: 45 in the morning, how much money does my mom make?
Answers: 1
You know the right answer?
The scatter plot shows the ages snd heights of 15 students in a physical education class. according...
Questions

Mathematics, 29.03.2021 17:40
Mathematics, 29.03.2021 17:40
Mathematics, 29.03.2021 17:40

Mathematics, 29.03.2021 17:40

History, 29.03.2021 17:40
English, 29.03.2021 17:40

Social Studies, 29.03.2021 17:40
Mathematics, 29.03.2021 17:40
Mathematics, 29.03.2021 17:40


