
Mathematics, 04.02.2020 14:59 debbie4755
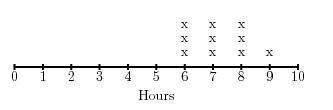
Consider the dot plot which shows the distribution of data collected on the amount of time jason sleeps each night. find the difference between the mean and median. (round to nearest tenth)
a) 0.2
eliminate
b) 0.3
c) 0.6
d) 0.8

Answers: 1


Another question on Mathematics
Mathematics, 22.06.2019 01:30
Simplify 1/3 12x - 6 a. -2x-1 b.-2x-8 c.-x+4 d.3x+10 e. 4x-2
Answers: 1
Mathematics, 22.06.2019 02:00
Which of the following transformations will make coincide with ? a. counter-clockwise rotation 90º about a, followed by a translation 5 units to the right b. translation 5 units to the right, followed by a reflection across the y-axis c. translation 5 units to the right, followed by a reflection across the x-axis d. translation 1 unit up and 5 units to the right, followed by a reflection across the x-axis
Answers: 3
You know the right answer?
Consider the dot plot which shows the distribution of data collected on the amount of time jason sle...
Questions

Mathematics, 18.12.2020 21:10

History, 18.12.2020 21:10
Mathematics, 18.12.2020 21:10

History, 18.12.2020 21:10
Mathematics, 18.12.2020 21:10
Mathematics, 18.12.2020 21:10
Mathematics, 18.12.2020 21:10
Mathematics, 18.12.2020 21:10

Arts, 18.12.2020 21:10


