a data that changes over time

Mathematics, 21.09.2019 12:10 abby986
1which type of data is best represented using a line plot?
a data that changes over time
b data that is spread out over a large range of numbers
c frequency data that can be plotted under categorical headings
d frequency data that can be plotted on a number line
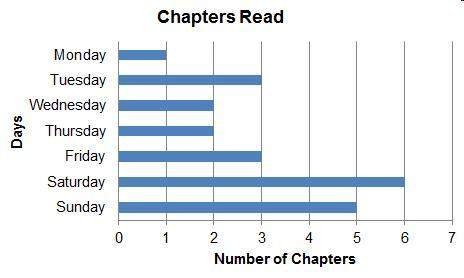
2 the graph shows the number of chapters sarah read in a book each day of a week.
which statements are true? check all that apply.
a sarah read twice as many chapters wednesday as monday.
b sarah read twice as many chapters sunday as tuesday.
c sarah read more than four chapters on two days.
d the most chapters sarah read on one day is five.
e sarah read fewer than two chapters on three days.
f sarah read at least three chapters on four days.
g the total number of chapters sarah read on the weekend was more than the total number she read on the weekdays.
h the total number of chapters sarah read on the weekend was the same as the total number she read on the weekdays.

Answers: 2


Another question on Mathematics
Mathematics, 21.06.2019 14:10
What is the slope of the line that contains the points (4,8) and (9,8)? what type of line is it?
Answers: 2
Mathematics, 21.06.2019 17:00
Complete the equation of the line through (−10,3) and (−8,−8). use exact numbers.
Answers: 1
Mathematics, 21.06.2019 18:20
Find the solution of this system of equation -7x+y=-20 9x-3y=36
Answers: 1
Mathematics, 21.06.2019 21:30
Amir wants to proportionally increase the size of a photo to create a poster for his room. the size of the original photo is shown. complete the statement and then answer the question to represent ways that amir can increase the size of his photo.
Answers: 2
You know the right answer?
1which type of data is best represented using a line plot?
a data that changes over time
a data that changes over time
Questions


English, 27.07.2019 10:20
History, 27.07.2019 10:20

Arts, 27.07.2019 10:20
Mathematics, 27.07.2019 10:20
History, 27.07.2019 10:20

Health, 27.07.2019 10:20

History, 27.07.2019 10:20


Social Studies, 27.07.2019 10:20
Biology, 27.07.2019 10:20


