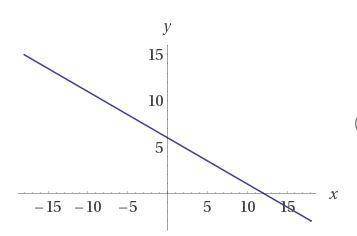
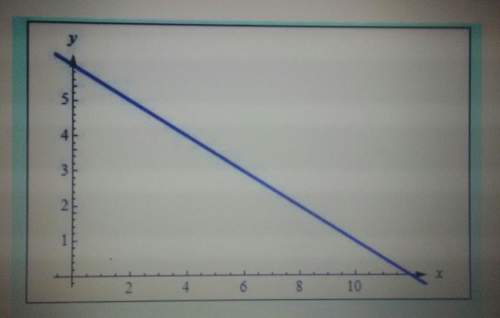
Which function is represented by the graph?
a). f(x)=-2x+6
b). f(x)2x+6
...

Mathematics, 31.01.2020 19:46 91miketaylor
Which function is represented by the graph?
a). f(x)=-2x+6
b). f(x)2x+6
c). f(x)1/2x +6
d). f(x)=-1/2x +6

Answers: 1


Another question on Mathematics
Mathematics, 21.06.2019 17:10
The frequency table shows a set of data collected by a doctor for adult patients who were diagnosed with a strain of influenza. patients with influenza age range number of sick patients 25 to 29 30 to 34 35 to 39 40 to 45 which dot plot could represent the same data as the frequency table? patients with flu
Answers: 2
Mathematics, 21.06.2019 19:00
Which shows one way to determine the factors of 4x3 + x2 – 8x – 2 by grouping?
Answers: 1
You know the right answer?
Questions


Mathematics, 11.03.2021 05:10


Mathematics, 11.03.2021 05:10

Business, 11.03.2021 05:10

History, 11.03.2021 05:10
English, 11.03.2021 05:10
English, 11.03.2021 05:10


