
Mathematics, 22.01.2020 11:31 zombiechick180
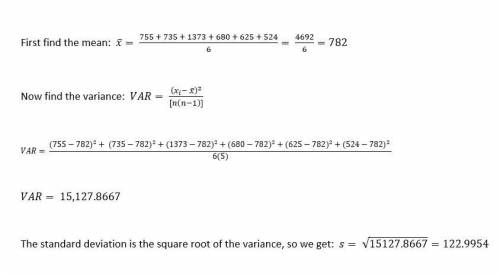
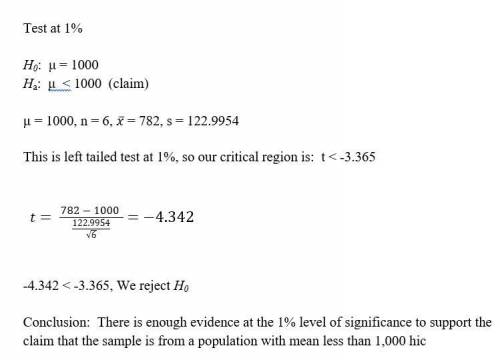
Assume that a simple random sample has been selected from a normally distributed population and test the given claim. identify the null and alternative hypotheses, test statistic, p-value, and state the final conclusion that addresses the original claim. a safety administration conducted crash tests of child booster seats for cars. listed below are results from those tests, with the measurements given in hic (standard head injury condition units). the safety requirement is that the hic measurement should be less than 1000 hic. use a 0.01 significance level to test the claim that the sample is from a population with a mean less than 1000 hic. do the results suggest that all of the child booster seats meet the specified requirement? 755 735 1373 680 625 524

Answers: 1


Another question on Mathematics
Mathematics, 21.06.2019 16:10
The line containing the midpoints of the legs of right triangle abc where a(-5,5), b(1, 1), and c(3, 4) are the vertices.
Answers: 3
Mathematics, 21.06.2019 16:20
Browning labs is testing a new growth inhibitor for a certain type of bacteria. the bacteria naturally grows exponentially each hour at a rate of 6.2%. the researchers know that the inhibitor will make the growth rate of the bacteria less than or equal to its natural growth rate. the sample currently contains 100 bacteria.the container holding the sample can hold only 300 bacteria, after which the sample will no longer grow. however, the researchers are increasing the size of the container at a constant rate allowing the container to hold 100 more bacteria each hour. they would like to determine the possible number of bacteria in the container over time.create a system of inequalities to model the situation above, and use it to determine how many of the solutions are viable.
Answers: 1
Mathematics, 21.06.2019 16:40
One of the inventors of integrated circuits observed that the number of transistors that fit on an integrated circuit will double every 24 months. what type of relationship most appropriately models this situation?
Answers: 3
Mathematics, 21.06.2019 16:40
The table shows the total distance that myra runs over different time periods. which describes myra’s distance as time increases? increasing decreasing zero constant
Answers: 2
You know the right answer?
Assume that a simple random sample has been selected from a normally distributed population and test...
Questions

Health, 05.02.2021 14:00
Mathematics, 05.02.2021 14:00


World Languages, 05.02.2021 14:00
Health, 05.02.2021 14:00
Chemistry, 05.02.2021 14:00
Mathematics, 05.02.2021 14:00


Mathematics, 05.02.2021 14:00
Mathematics, 05.02.2021 14:00
Mathematics, 05.02.2021 14:00
Mathematics, 05.02.2021 14:00


